15 Customer Journey KPIs to Track Across All Stages
When was the last time you mapped out your customer journey and asked yourself:
Are we actually tracking the right metrics, or just drowning in vanity data?
Most businesses track signups, conversions, and churn. But the real magic lies in looking at customer journey KPIs across different stages from awareness to advocacy. These are the signals that reveal not just what’s happening, but why it’s happening.
Let’s check out the 15 most important customer journey metrics, stage by stage, so you can measure what really matters.
What is Customer Journey KPI?
Customer Journey KPIs (Key Performance Indicators) are the measurable metrics that tell you how well customers are moving through each stage of their journey with your business — from discovering your brand to becoming loyal advocates.
Think of them as checkpoints across the journey that help you answer:
- Are people finding us?
- Are they engaging with us?
- Are they converting into paying customers?
- Are they sticking around?
- Are they recommending us?
Why Customer Journey KPIs Are Non-Negotiable
Tracking customer journey performance metrics isn’t about collecting pretty dashboards—it’s about building a system where data fuels decisions.
Think about it:
- If you know which ads bring awareness but fail to move people to sign-up, you can fix the funnel.
- If you can spot friction in onboarding before churn happens, you can rescue customers in real time.
- If you know exactly when loyalty peaks, you can turn happy users into brand advocates.
Without these key performance indicators for customer journey, you’re essentially blindfolded, trying to steer your growth strategy by gut feel.
This is where PLG OS comes into play. It’s not just another analyticsplatform—it’s a Product-Led Growth operating system that stitches together customer journey stages metrics, so you can act on them without guesswork.
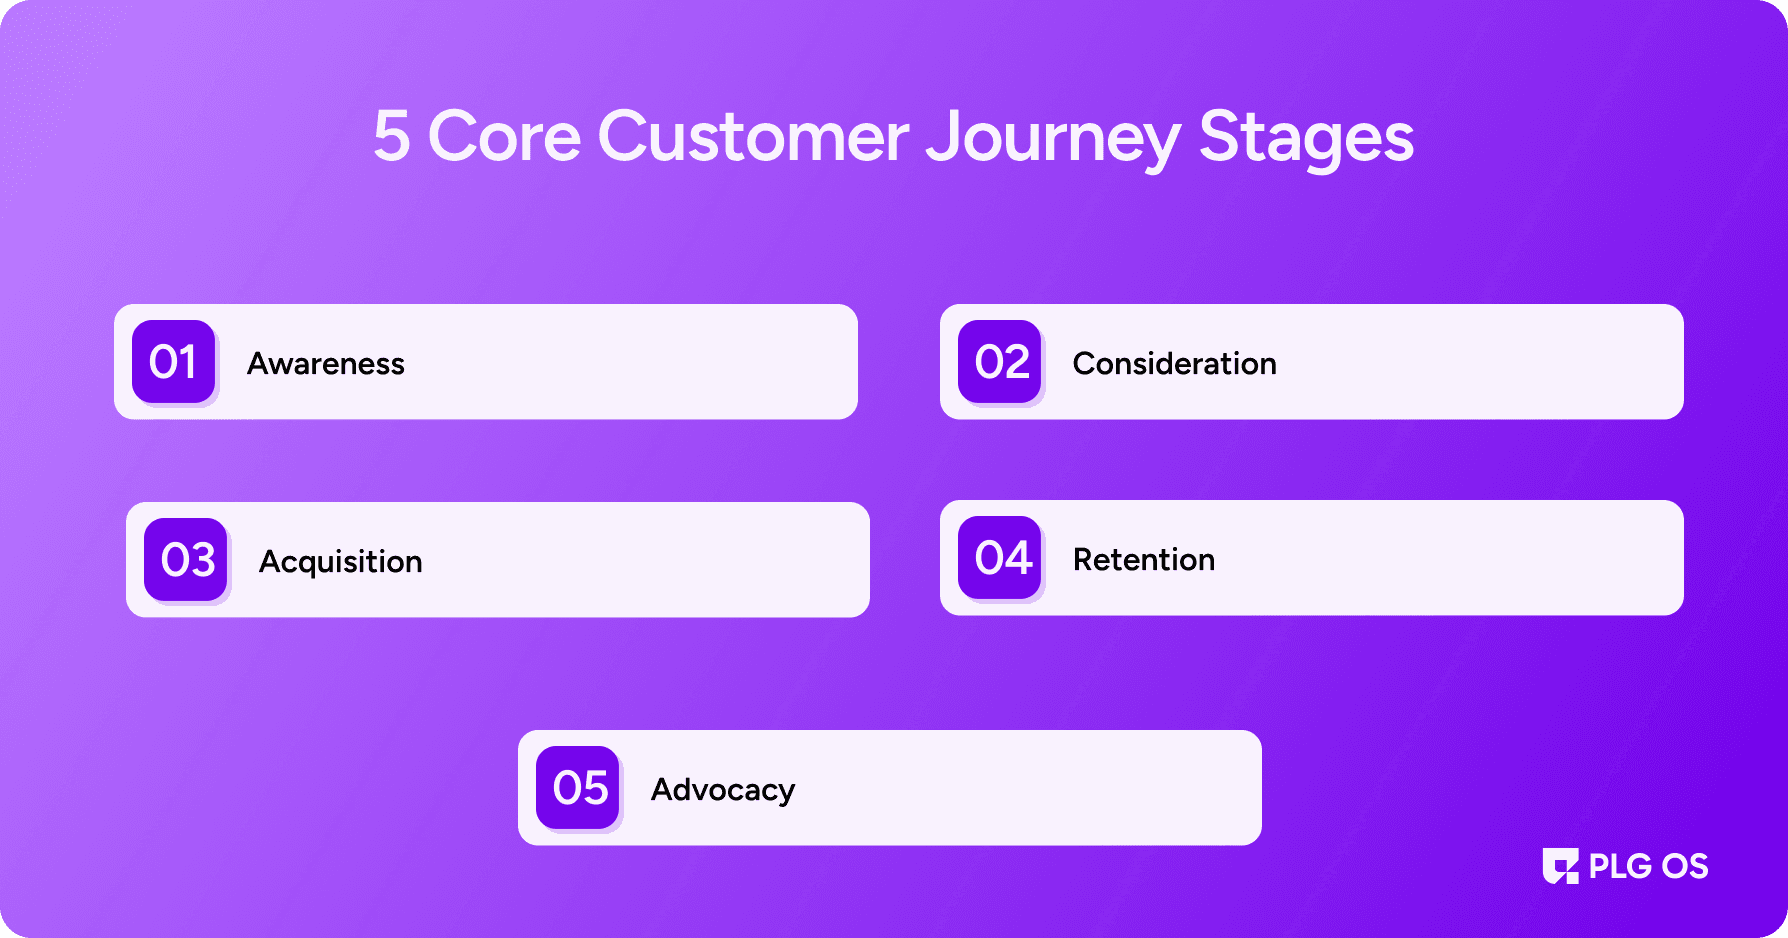
The 5 Core Customer Journey Stages
Before diving into KPIs, let’s set the stage.
Every customer journey can be broken down into five essential phases:
- Awareness – When prospects first discover your brand.
- Consideration – When they’re evaluating whether your solution fits.
- Acquisition – When they make the leap and become a customer.
- Retention – When they stick around (or don’t).
- Advocacy – When they go beyond satisfied customers and become promoters.
Each of these phases requires different customer journey tracking KPIs. Measuring them correctly means you’re not just optimizing isolated touchpoints—you’re optimizing the entire journey. In early-stage SaaS (< ~$300K ARR), monthly customer churn tends to be higher (median ~6.5%), but as ARR scales up (>$3-8M), median churn drops to ~1.5-4% per month.
15 Customer Journey KPIs You Must Track
Stage 1: Awareness
At this stage, the goal is simple: make people aware that you exist. But awareness without engagement is just noise.
1. Website Traffic (Volume + Quality)
Yes, raw traffic is easy to measure. But the quality of traffic—time on site, bounce rate, and engagement—tells you whether you’re attracting the right audience.
Why it matters: Driving thousands of visitors is useless if they’re the wrong people. Track traffic relevance, not just volume.
2. Social Reach & Engagement
Likes and shares are vanity metrics if taken in isolation. But paired with CTR and conversions, they become meaningful customer journey performance metrics.
Pro tip: Use PLG OS to track which campaigns actually drive downstream signups—not just impressions.
3. Brand Search Volume
If people are Googling your brand directly, your awareness efforts are working. A steady increase in branded searches is one of the strongest early customer journey KPI examples.
Stage 2: Consideration
Here, prospects are evaluating you against competitors. Your KPIs should measure engagement and intent.
4. Lead-to-Customer Conversion Rate
It’s not about how many leads you get—it’s about how many actually convert. This is one of the most revealing customer journey stages metrics.
5. Content Engagement (Downloads, Views, Time Spent)
Content is a bridge between awareness and acquisition. If prospects engage deeply with case studies, webinars, or comparison guides, that’s a sign of serious intent.
With PLG OS: You can tie this engagement directly to pipeline movement.
6. Demo or Free Trial Sign-Ups
This is the ultimate consideration KPI. People who request a demo or trial are saying, “I’m willing to test you out.”
Key metric: Not just number of signups, but completion of activation milestones.
Stage 3: Acquisition
This is where money changes hands. Here, KPIs should track not just acquisition, but acquisition efficiency.
7. Customer Acquisition Cost (CAC)
Classic, but critical. Knowing how much it costs to acquire a paying customer keeps your growth sustainable.
PLG OS advantage: You can track CAC by channel, helping you double down on what works.
8. Free-to-Paid Conversion Rate
In a product-led world, this is one of the most important KPIs for each stage of customer journey.
Ask: How many trial users or freemium accounts convert into paying customers?
9. Sales Cycle Length
How long does it take for a lead to become a customer? Shorter cycles often signal a smoother experience (and higher efficiency).
Stage 4: Retention
Acquisition is expensive. Retention is profitable. If you’re not tracking retention KPIs, you’re missing the heartbeat of your business.
10. Churn Rate
The most brutal of all customer journey performance metrics. If customers are leaving, everything upstream is wasted.
Formula: (Customers lost ÷ Customers at start of period) × 100.
11. Net Revenue Retention (NRR)
NRR shows how much revenue you retain after upgrades, downgrades, and churn. It’s the holy grail of SaaS retention KPIs.
12. Product Usage Frequency
Logins, feature adoption, and active usage are powerful indicators of long-term stickiness.
Pro tip: With PLG OS, you can set alerts when usage drops, so your team can intervene before churn happens.
Stage 5: Advocacy
The final stage is where loyal customers turn into evangelists—driving organic growth.
13. Net Promoter Score (NPS)
Simple, powerful, and predictive. Customers who rate you 9 or 10 are your advocates.
But here’s the twist: Don’t just collect NPS—tie it back tocustomer behavior in PLG OS to understand what creates promoters.
14. Referral Rate
How many new customers come via word-of-mouth or referral programs? This is one of the strongest signals of advocacy.
15. Customer Lifetime Value (CLV)
Ultimately, the KPI that connects all stages together. CLV tells you how much value each customer brings over their lifetime.
Pro insight: If CLV is flat, look upstream. Weak advocacy or retention is usually the culprit.
How PLG OS Helps Customer Journey Tracking
Here’s the problem most companies face:
They have data scattered across 10+ tools—CRM, analytics, product usage, survey platforms—and none of it talks to each other.
That’s why PLG OS is such a game-changer. It acts as a central nervous system for customer journey KPIs, helping you:
- Unify metrics across stages (from awareness to advocacy).
- Spot friction points in real time before they tank conversion.
- Align product, marketing, and sales around the same journey data.
- Automate playbooks that trigger when KPIs cross certain thresholds (e.g., low usage alerts).
Instead of drowning in dashboards, PLG OS helps you operationalize customer journey performance metrics turning insight into action.
Common Mistakes Companies Make with Customer Journey KPIs
Before you rush off to track everything, here are pitfalls to avoid:
Mistake 1: Tracking Vanity Metrics
High follower counts or downloads don’t matter unless they connect to actual business outcomes.
Mistake 2: Measuring in Silos
Marketing tracks traffic. Sales tracks deals. Product tracks usage. Nobody connects the dots. That’s why PLG OS is crucial—it unites these perspectives.
Mistake 3: Ignoring Stage Transitions
It’s not enough to measure within stages. You need to track how customers move between stages. That’s where growth opportunities hide.
Customer Journey KPI Examples in Action
B2B SaaS monthly churn for SMBs tends to be 3%–7%, while enterprise-focused SaaS companies often achieve 1%–2% monthly churn. Let’s imagine a SaaS company. Here’s how their customer journey metrics might play out:
- Awareness: 50K website visitors → 10% click-through to product pages.
- Consideration: 5K trial signups → 30% reach activation milestone.
- Acquisition: 1.5K convert to paid → CAC = $150.
- Retention: 90% NRR, with churn rate of 2%.
- Advocacy: 25% NPS promoters → 10% referral rate.
Now imagine this data siloed across five tools. It’s a nightmare. But with PLG OS, you’d see the entire flow—and act on it with precision.
Final Thoughts
Tracking customer journey KPIs isn’t optional anymore. It’s the difference between guessing your way through growth and running a predictable, scalable engine.
The 15 KPIs we’ve covered—spanning awareness, consideration, acquisition, retention, and advocacy—give you a complete blueprint for customer journey tracking.
But here’s the key:
- Don’t just measure.
- Don’t just create dashboards.
- Operationalize your KPIs with PLG OS so every team member can act on them.
When you do, you stop chasing data—and start driving growth.
FAQs
1. What are customer journey KPIs?
They are key performance indicators that measure how effectively customers move through each stage of their journey—from awareness to advocacy.
2. Why are customer journey KPIs important?
They help you identify friction points, optimize the customer experience, and align marketing, sales, and product teams around measurable outcomes.
3. What are examples of customer journey KPIs?
Examples include website traffic, free-to-paid conversion rate, churn rate, Net Promoter Score (NPS), and Customer Lifetime Value (CLV).
4. How do you track customer journey KPIs?
You can track them using analytics tools, CRMs, and product-led growth platforms like PLG OS that unify data across stages.
5. Which stage of the journey has the most important KPIs?
All stages matter. Awareness shows reach, acquisition proves value, retention sustains growth, and advocacy drives long-term scalability.