Top 9 Mobile App Engagement Metrics to Track in 2025

Tracking mobile app engagement metrics is critical for determining how people interact with your app. These analytics can help you find areas for improvement and increase user retention. In 2025, creating a successful mobile app is no longer about how many people download your app, it’s about how many people actually use it, love it, and keep coming back for more.
User attention spans are shrinking, competition is skyrocketing, and expectations have never been higher. In this landscape, tracking mobile app engagement metrics is not optional—it’s essential. These metrics provide the insights needed to improve retention, drive conversions, and build loyal user communities. Let’s dive into the top 9 user engagement metrics mobile app developers and product owners should be tracking in 2025.
What are Mobile App Engagement Metrics?
Mobile app engagement metrics are useful tools that provide insights into how users interact with your application. These data are critical for discovering ways to increase user retention and avoid bad user experiences. Tracking these engagement indicators enables app developers to assess app engagement and make informed decisions to improve app functionality and user experience. Additionally, understanding mobile apps can increase user pleasure and engagement. The average smartphone owner uses 9-10 apps per day and 30 per month.
Understanding user behavior through engagement metrics can help your app remain competitive in a crowded industry. These analytics offer useful data that help guide app development, product launch decisions, and marketing activities. They also emphasize user involvement with the software, demonstrating its worth and potential for monetization.
High user engagement levels indicate a successful application with a rising user base. Tracking user engagement data not only aids in determining the app's value, but it also promotes customer loyalty and boosts lifetime value. This understanding is critical for any app seeking long-term success.
Benefits of Mobile App Engagement Metrics
Understand User Behavior:
Engagement metrics reveal how users interact with your app—what features they use, how long they stay, and how often they return.
Improve Retention Rates:
By analyzing drop-off points and session patterns, you can optimize the user journey and boost long-term retention.
Enhance Product Decisions:
Data-backed insights guide smarter decisions on which features to improve, remove, or expand—reducing guesswork.
Boost Conversion Rates:
Identifying engagement bottlenecks helps fine-tune onboarding, CTAs, and in-app flows for better conversion.
Reduce Churn:
Spotting disengaged users early allows for timely interventions like personalized messaging or offers to win them back.
Optimize Marketing Campaigns:
Know which user segments are the most active and target them with tailored campaigns for higher ROI.
Prioritize Development Efforts:
Focus your team’s time and budget on high-impact updates that align with real user needs.
Support Product-Led Growth (PLG):
Metrics power PLG strategies by aligning product performance with growth outcomes—ensuring scalability and sustainability.
Deliver Personalized Experiences:
Understand preferences and behavior to offer custom content, recommendations, or feature access.
Validate Business Goals:
Engagement data helps align product success with business KPIs like revenue, activation, and customer satisfaction.
Top 9 Mobile App Engagement Metric to Track in 2025
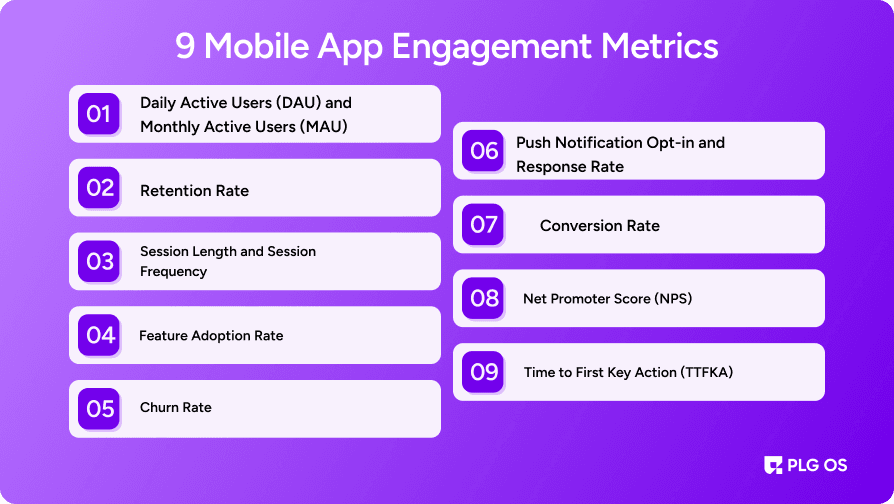
1. Daily Active Users (DAU) and Monthly Active Users (MAU)
Why it matters: DAU and MAU are fundamental indicators of app stickiness. These metrics help you understand how many users are engaging with your app on a daily and monthly basis.
The DAU/MAU ratio is especially insightful. It tells you what percentage of your monthly users are returning daily. A higher ratio generally indicates that users find your app valuable enough to use regularly.
2025 Benchmark to Aim For:
A DAU/MAU ratio of 20% or more is considered healthy. Anything over 50% reflects strong engagement.
Pro Tip: Monitor DAU and MAU in relation to feature updates and marketing campaigns to track what drives meaningful engagement.
2. Retention Rate
Why it matters: Retention measures how many users return to your app after their first visit. It’s a clear indicator of whether your app is delivering lasting value.
Retention is typically tracked over Day 1, Day 7, and Day 30. These milestones can help identify early drop-offs and long-term engagement.
2025 Retention Benchmarks:
- Day 1: 25–30%
- Day 7: 15–20%
- Day 30: 8–10%
If users are not coming back after initial use, it’s time to examine your onboarding flow, app performance, or overall user experience.
3. Session Length and Session Frequency
Why it matters: These two app engagement metrics in 2025 give a deeper understanding of user behavior.
- Session length tells you how long a user stays active in a single app visit.
- Session frequency tells you how many times users are launching your app over a specific period.
Short but frequent sessions may indicate utility-driven behavior (such as checking news or to-do lists), while longer sessions could point to content-heavy or interactive apps (like games or e-learning platforms).
How to use it: Set session benchmarks based on your app category. Track changes when you introduce new features or redesigns.
4. Feature Adoption Rate
Why it matters: You may have built impressive features, but are users actually using them?
Feature adoption rate shows how effectively users are exploring and embracing different parts of your app. It helps you understand what resonates and what doesn’t.
This is particularly important for PLG-based models, where users self-navigate through features before converting to paying customers. Platforms like PLG OS allow product teams to measure adoption without needing complex custom tracking.
Actionable Tip: Measure feature adoption post-release and correlate it with retention, engagement, or conversion changes.
5. Churn Rate
Why it matters: Churn rate represents the percentage of users who stop using your app over a certain period. It’s the mirror opposite of retention.
High churn can indicate deeper issues — such as poor onboarding, lack of value, buggy experiences, or irrelevant content. Identifying patterns in churn can help product teams make decisive improvements. The uninstall rate improved by 10% in 2023 but still remains very high at 45%. The truth is, more than half of all apps installed are uninstalled within 30 days of being downloaded.
How to calculate:
Churn Rate = (Users lost during a time period / Users at the start of that period) × 100
2025 Insight: A monthly churn rate of more than 5% signals a need to reevaluate user experience and retention strategy.
6. Push Notification Opt-in and Response Rate
Why it matters: Push notifications are a direct line to your users, but misusing them can lead to app uninstalls.
This metric measures:
- How many users have opted in to receive push notifications.
- How often users engage with them (click-through rate, conversion rate post-click).
Effective push notifications should be personalized, timely, and relevant. In 2025, AI-powered segmentation tools help tailor messages to user behavior, increasing effectiveness.
Tip: Monitor opt-in rates after onboarding and test variations in tone, timing, and content to improve response rates.
7. Conversion Rate
Why it matters: Engagement is not just about usage; it’s also about moving users toward key goals, whether that’s signing up, subscribing, purchasing, or completing tasks.
Conversion metrics should be defined according to your app’s primary objective. It could be:
- Completing the onboarding flow
- Starting a free trial
- Making a first purchase
- Upgrading to a premium tier
2025 Trend: Product teams are using behavioral analytics to personalize conversion paths. Platforms like PLG OS offer user segmentation and funnel analytics to help identify bottlenecks and optimize conversion flow.
8. Net Promoter Score (NPS)
Why it matters: Numbers tell part of the story, but NPS captures user sentiment and loyalty.
Net Promoter Score measures how likely users are to recommend your app to others, typically on a scale from 0 to 10.
- Promoters (9–10): Loyal and enthusiastic
- Passives (7–8): Satisfied but unenthusiastic
- Detractors (0–6): Unhappy users
NPS is not just a vanity score. When analyzed alongside behavior metrics, it can reveal deep insights about what keeps users satisfied and where pain points exist.
Strategy: Combine NPS with in-app surveys and follow-up questions to uncover what’s driving your score.
9. Time to First Key Action (TTFKA)
Why it matters: This emerging metric focuses on how long it takes a new user to experience the app’s core value.
The faster users reach that “aha!” moment — such as creating their first project, completing a task, or receiving their first reward — the more likely they are to stay engaged.
TTFKA helps teams streamline onboarding and reduce user friction. In 2025, this metric is central to PLG strategies, as it directly influences retention and conversion.
Example: A note-taking app might track how long it takes for a user to write and save their first note. Reducing the time to this moment can significantly boost long-term engagement.
How PLG OS Can Supercharge Your Engagement Strategy
Tracking mobile app engagement metrics is essential but the real game-changer is knowing what to do with that data. That’s where PLG OS steps in.
PLG OS is a powerful Product-Led Growth platform designed to help teams convert engagement insights into real growth. It offers a centralized view of user behavior across the funnel from activation and feature adoption to churn and conversion.
With PLG OS, you can segment users based on behavior, run no-code experiments, and personalize user journeys all without heavy engineering involvement. Its built-in playbooks let you launch data-driven engagement strategies in minutes, whether you're optimizing onboarding, boosting retention, or increasing upsells.
What sets PLG OS apart is its ability to close the feedback loop fast. It helps you act on NPS results, usage trends, and drop-off points to continuously improve your product experience.
In short, PLG OS doesn’t just help you track what’s happening it empowers you to take action. For any team embracing product-led growth in 2025, it’s the ultimate engine to drive smarter engagement and scale sustainably.
Wrapping Up
With user expectations at an all-time high, tracking user engagement metrics for mobile apps is no longer optional. These mobile app KPIs in 2025 help you understand what’s working, what needs improvement, and how to align your product with actual user behavior.
Whether you’re a startup looking to grow or an enterprise seeking to optimize user experience, platforms like PLG OS offer powerful tools to make data-driven product decisions faster.
In the end, successful mobile apps in 2025 will not be defined by how many people download them, but by how many people find lasting value in them. These engagement metrics are your compass use them wisely to build better products, drive meaningful growth, and deliver real impact.
FAQs
1. What are mobile app engagement metrics?
They are key indicators that show how users interact with your app, such as how often they return, how long they stay, and what features they use.
2. Why should I track user engagement metrics in a mobile app?
Tracking engagement helps you understand user behavior, identify what’s working, reduce churn, and improve overall app performance.
3. What are the most important app engagement metrics in 2025?
Metrics like DAU/MAU, retention rate, session length, feature adoption, and time to first key action are especially critical in 2025.
4. How is PLG OS different from standard analytics tools?
PLG OS goes beyond tracking—it helps you experiment, segment users, run engagement playbooks, and improve retention using product-led strategies.
5. Can PLG OS help reduce churn?
Yes. PLG OS helps identify churn risks, streamline onboarding, and personalize user experiences, all of which contribute to higher retention.