7 Powerful SaaS Metrics to Track to Skyrocket CLV
Think your SaaS is doing well? Think again until you’ve mastered CLV. You can build the slickest product. You can hire the best sales team. However, without a growing Customer Lifetime Value (CLV), your business faces significant challenges. In today's ultra-competitive SaaS landscape, it’s not just about acquiring customers. It’s about keeping them, growing them, and turning them into your biggest revenue drivers. Let’s talk about the 7 most powerful SaaS metrics to track the ones that actually move the needle when it comes to CLV. These are not vanity metrics.
These are the CLV metrics for SaaS companies who are serious about sustainable, compounding growth.
What is CLV?
Customer Lifetime Value in SaaS is the total revenue a customer brings during their entire relationship with your product. It’s the north star metric for any SaaS startup or enterprise.
Acquisition is expensive. Retention is ROI.
You want to:
- Maximize revenue per customer
- Reduce churn
- Extend relationships
- Upsell and cross-sell smartly
You can’t do any of that without laser-focusing on the key metrics for SaaS companies that influence CLV.
Why Is Customer Lifetime Value (CLV) Important?
Understanding your Customer Lifetime Value (CLV) is essential for building a sustainable SaaS business. Here’s why:
1. Proof of Concept & Business Forecasting
A high CLV is a strong indicator that your product fits the market and resonates with your audience. It validates your product’s value, shows that you understand your customer personas, and allows you to forecast future revenue with more confidence.
2. Smarter Customer Acquisition Spending
Two key SaaS business metrics you must track are:
- Customer Lifetime Value (CLV)
- Customer Acquisition Cost (CAC)
A healthy CLV:CAC ratio is around 3:1—you earn €3 for every €1 spent acquiring a customer. If it’s 1:1, you're not profitable. If it’s 5:1 or higher, you may be under-investing in growth opportunities.
3. Targeted Marketing Strategy
CLV highlights which products are driving revenue. If customers are only engaging with a couple of your offerings, it tells you where to focus your marketing efforts and which products need improvement.
4. Tracking Real Growth
In a subscription-based model, retention is critical. A steadily increasing CLV means your customers are satisfied.
7 Powerful SaaS Metrics to Track
| SaaS Metric | Description |
|---|---|
| 1. Monthly Recurring Revenue (MRR) | MRR is the lifeblood of any SaaS business. It provides a clear picture of your predictable revenue stream and helps you forecast future growth. By monitoring MRR, you can identify trends, assess the impact of pricing changes, and evaluate the effectiveness of your sales strategies. |
| 2. Net Promoter Score (NPS) | NPS measures customer satisfaction and loyalty by asking how likely customers are to recommend your service to others. A high NPS indicates a strong customer experience, which can lead to increased referrals and reduced churn. Regularly tracking NPS allows you to address customer concerns proactively and improve your offerings. |
| 3. Average Revenue Per User (ARPU) | ARPU helps you understand how much revenue each customer generates on average. By analyzing this metric, you can identify opportunities to upsell or cross-sell additional features or services, ultimately increasing your CLV. |
| 4. Churn Rate | This metric indicates the percentage of customers who cancel their subscriptions within a given period. A high churn rate can significantly impact your CLV, so it’s essential to identify the reasons behind customer attrition. By addressing these issues, you can improve retention and enhance customer satisfaction. |
| 5. Customer Acquisition Cost (CAC) | CAC measures the cost associated with acquiring a new customer. By keeping this metric in check, you can ensure that your marketing and sales efforts are efficient. A lower CAC means you can invest more in retaining existing customers, which is vital for boosting CLV. |
| 6. Customer Segmentation | Understanding the different segments of your customer base allows you to tailor your marketing and retention strategies effectively. By analyzing customer behavior and preferences, you can create targeted campaigns that resonate with specific groups, leading to higher engagement and loyalty. |
| 7. Annual Recurring Revenue (ARR) | Similar to MRR, ARR provides a long-term view of your revenue stream. Tracking ARR helps you assess the overall health of your business and make informed decisions about future investments and growth strategies. |
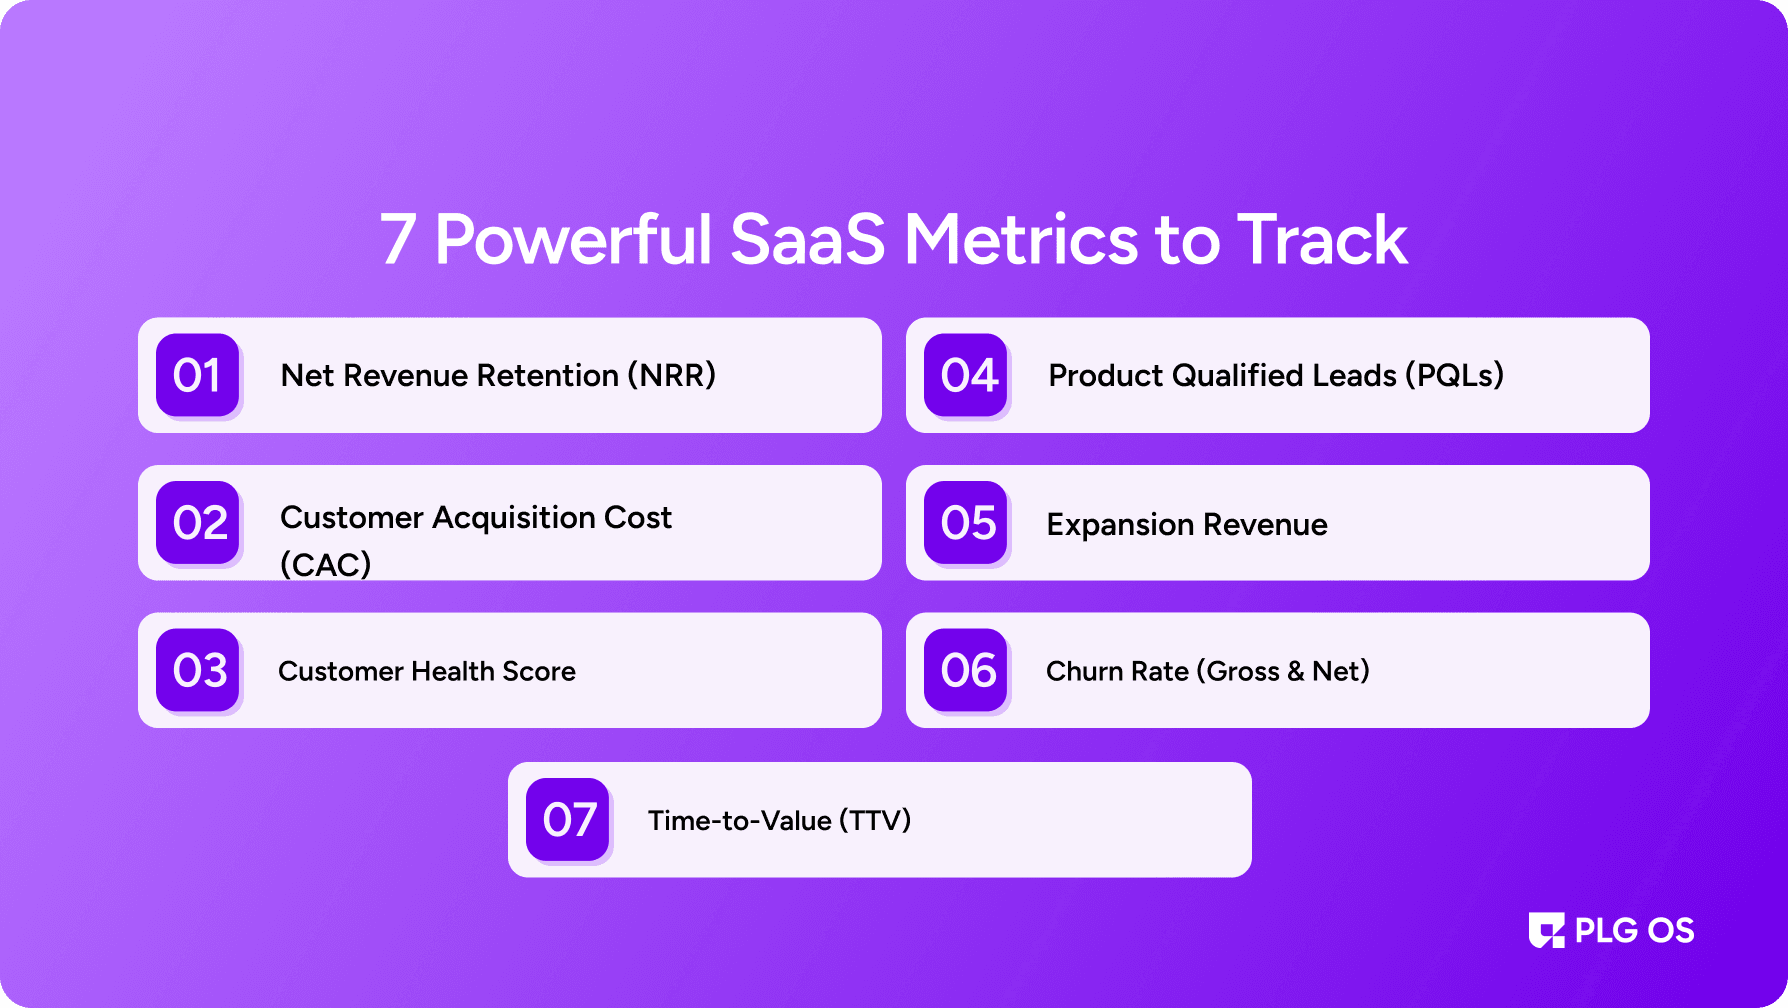
1. Net Revenue Retention (NRR)
NRR = [(Current MRR + Expansion – Contraction – Churn) / Starting MRR] × 100
NRR shows how much recurring revenue you retain from existing customersincluding upgrades, downgrades, and churn. Median NRR for bootstrapped SaaS companies ($3M–$20M ARR) is 104%; top 10% reach 118%.
Why it matters:
- If your NRR is >100%, you’re growing even without new customers.
- It's the heartbeat of every PLG strategy.
- Top-tier SaaS companies (like Snowflake and Datadog) boast NRRs of 130–140%. That’s not precision in SaaS customer success metrics.
How it skyrockets CLV:
Customers who expand their usage stay longer and spend more. A healthy NRR means your team’s focusing on retention, activation, and expansion, massive CLV boosters.
2. Customer Acquisition Cost (CAC)
CAC Payback = CAC / (Monthly Gross Margin per Customer)
Knowing how long it takes to recoup the money you spent acquiring a customer is critical. A shorter payback period means faster profitability and a better CLV-to-CAC ratio.
Why it matters:
- Investors love a short CAC payback period.
- It shows the efficiency of your growth engine.
- In PLG models, this metric often shrinks dramatically because the product itself does the heavy lifting.
How it impacts CLV:
The faster you recoup acquisition costs, the more you can reinvest in customer success, support, and feature upgrades, all of which lengthen lifetime value.
3. Customer Health Score
The Customer Health Score combines factors like product usage, support tickets, NPS scores, feature adoption, and more. It’s like a Fitbit for your customer relationship.
Why it matters:
- It predicts churn before it happens.
- It helps your customer success team intervene proactively.
- It guides personalized outreach and engagement.
How it fuels CLV:
Healthy customers don’t just stay, they evangelize. High scores correlate directly with renewals, upsells, and referrals. It’s one of the most underrated SaaS KPIs to improve CLV.
Pro Tip: Build a dynamic health score model that evolves as your product and user behavior change.
4. Product Qualified Leads (PQLs)
In PLG, forget about MQLs. The real magic is in PQLs users who’ve experienced meaningful product value and are primed for conversion.
Why it matters:
- PQLs convert at 5–10x higher rates than traditional leads.
- They’re already using your product, so the CAC is lower.
- With the PLG OS framework, you can pinpoint, nurture, and close PQLs at scale.
How it influences CLV:
Because PQLs start with a better product fit, they stick around longer, adopt features faster, and are more likely to expand. That’s a compounding effect on CLV.
5. Expansion Revenue
Expansion revenue includes upsells, cross-sells, and add-ons. In a well-oiled SaaS model, this should become your biggest growth lever.
Why it matters:
- Existing customers are far easier to sell to than new ones.
- Every dollar of expansion directly adds to CLV.
- High-performing SaaS companies generate 30–50% of revenue from expansion.
How it enhances CLV:
Upselling increases the average revenue per account (ARPA), while reducing reliance on new acquisitions. It's one of the most direct and scalable ways to boost CLV.
PLG OS Insight: Use in-product nudges, feature gates, and personalized messages to drive self-service expansion.
6. Churn Rate (Gross & Net)
Churn = (Lost Customers or Revenue / Total at Start of Period) × 100
Churn eats your CLV the most. Whether it’s customer churn or revenue churn, ignoring this metric is like driving with your eyes closed. Average B2B SaaS churn is 3.5%, with 2.6% voluntary churn & 0.8% involuntary .
Why it matters:
- Even a 1% increase in churn can decimate growth.
- Gross churn reflects retention. Net churn shows the impact of expansion.
- Reducing churn is more cost-effective than boosting acquisition.
How it affects CLV:
Lower churn = longer customer relationships = higher lifetime value. It's that simple. Track both gross and net churn monthly and dissect reasonswas it poor onboarding, bad fit, lack of engagement?
7. Time-to-Value (TTV)
TTV = The time it takes for a new user to reach their first "aha!" moment. Personalized 7-day trial can boost subscriptions by ~5.6%, reflecting how onboarding speed boosts conversion.
Time is everything. The faster users get value, the more likely they are to stick around.
Why it matters:
- Long TTV means more drop-offs.
- PLG thrives on frictionless, fast-first value.
- It directly impacts activation, retention, and ultimately CLV.
How it multiplies CLV:
TTV is the first domino. Reduce it, and you'll see higher user satisfaction, feature adoption, and renewalspushing your CLV upward.
Use PLG OS playbooks to automate onboarding flows, personalize journeys, and show value faster.
How PLG OS Supercharges These SaaS Metrics to Track
If you're in the process of building or scaling a PLG motion, the PLG OS is the key to success. Created by the pioneers at OpenView, it’s a battle-tested operating system that helps product-led companies:
- Drive PQL conversions
- Automate onboarding and engagement
- Track usage patterns and expansion triggers
- Feedbacks and Surveys for your loading page
With PLG OS, you're not just tracking these SaaS business metrics, you’re orchestrating them into one seamless, growth-obsessed system.
7 SaaS KPIs to improve CLV
| Metric | Why It Matters | Impact on CLV |
|---|---|---|
| Net Revenue Retention (NRR) | Growth from existing users | Direct expansion of value |
| CAC Payback Period | Revenue recovery speed | Informs sustainable scaling |
| Customer Health Score | Early churn detection | Boosts retention and satisfaction |
| Product Qualified Leads (PQLs) | High-converting lead source | Lower CAC, better retention |
| Expansion Revenue | Scalable growth | Increases ARPA and loyalty |
| Churn Rate | Revenue leakage | Lower churn = longer CLV |
| Time-to-Value (TTV) | Faster activation | Builds long-term engagement |
Final Thought: Track Smarter, Grow Faster
In the SaaS industry, tracking metrics like Monthly Recurring Revenue (MRR) and Annual Recurring Revenue (ARR) helps companies understand how much revenue per user (ARPU) they're generating. Offering free trials can boost the number of new customers, but it's essential to calculate the cost of acquiring each single customer to ensure profitability.
Enhancing customer experience and leveraging customer segmentation allow companies to better serve a higher percentage of customers, leading to improved retention. Tools like Net Promoter Score (NPS) can help gauge satisfaction levels and refine strategies to acquire new customers more effectively. Monitoring the average revenue per user and total customers generate valuable insights for scaling.
So go ahead, plug into PLG OS to refine these metrics and start skyrocketing your CLV.
FAQs
1. What is Customer Lifetime Value (CLV) in SaaS?
CLV is the total revenue a SaaS business can expect from a customer throughout their relationship with the company.
2. Why is CLV important for SaaS companies?
It helps you understand profitability, guides marketing spend, improves retention strategies, and supports long-term growth planning.
3. How do you calculate CLV simply?
CLV = Average Monthly Revenue per Customer × Average Customer Lifespan (in months)
4. What’s a good CLV to CAC ratio?
A healthy SaaS business should aim for a CLV:CAC ratio of 3:1—you earn 3 times more than what you spend to acquire a customer.
5. How can I increase CLV?
Improve onboarding, reduce churn, upsell existing users, and enhance product engagement to lengthen customer relationships and increase revenue.