Top 6 Dashboard Reporting Tools for SaaS 2025

SaaS has evolved from a convenient cloud solution to the primary driver of the fast-growing cloud computing business. With a market value predicted to reach $716.52 billion by 2028, practically all enterprises worldwide will use SaaS in some way.
However, SaaS without reporting is analogous to having a firm without a budget: you're operational but have no idea where your resources are going.
That’s where dashboard reporting tools for SaaS in 2025 step in.
Let’s check out the Top 6 SaaS dashboard reporting tools that aren’t just riding the trend they’re redefining how SaaS businesses grow, scale, and dominate.
Ready to transform your SaaS data into growth rocket fuel?
Let’s go.
What is a dashboard reporting tool?
A dashboard reporting tool is a type of software that consolidates and visually presents key business metrics in a single, easy-to-understand interface. These dashboards provide real-time insights into performance, helping you quickly spot trends, track progress, identify issues, and make informed decisions.
By simplifying data management and eliminating the need to jump between platforms, these tools allow you to focus on the metrics that matter most efficiently and effectively.
What to Look for in Dashboard Software
Choosing the right dashboard software means selecting a tool that not only displays your data but also empowers your team to act on it. Here are the top qualities to consider:
1. Ease of Use
The tool should be user-friendly and intuitive, enabling team members, regardless of technical expertise to easily navigate and leverage its features without a steep learning curve.
2. Customization Capabilities
No two businesses are alike. Look for software that allows you to tailor dashboards to your needs, including the ability to choose visualization formats, define custom metrics, and design views for different teams or departments.
3. Seamless Integrations
A powerful dashboard becomes even more valuable when it connects effortlessly with your existing tools, such as CRMs, billing platforms, product analytics, or marketing systems. Integration ensures a unified view of your data across all touchpoints.
4. Cost-Effectiveness
While pricing matters, focus on the value the software brings. The best solutions strike a balance between essential features and affordability, delivering functionality that supports your business goals without stretching your budget.
5. Data Privacy & Security
As data regulations tighten, your dashboard tool must uphold high standards of privacy and security. Choose a solution that offers robust encryption, user access controls, and compliance with major data protection laws to keep your information safe.
Why Dashboard Reporting Tools Matter More Than Ever in 2025
2025 is not just another year in SaaS. It’s a data renaissance. With every customer touchpoint generating data from product usage to in-app behavior to subscription churn you’re sitting on a goldmine. But without the right tools, it’s just noise.
Dashboard Reporting Tools: The New SaaS Growth Engine
- Faster Decisions: In 2025, static reports are obsolete. Real-time dashboards help teams make agile, confident decisions.
- Alignment Across Teams: Product, marketing, customer success, and leadership need a single source of truth. Dashboards make that happen.
- Product-Led Growth (PLG): With PLG strategies booming, knowing how users interact with your product at every touchpoint is crucial. Dashboards enable that visibility.
- Investor & Board Reporting: You no longer have time for manual data wrangling. Automated dashboard reporting tools streamline monthly and quarterly updates.
So what makes a tool qualify as one of the top dashboard reporting tools for SaaS in 2025?
Let’s break it down.
What Makes the Best SaaS Dashboard Software in 2025?
91% of SaaS companies say they are investing more in analytics and dashboard tools in 2025 compared to previous years. Here’s what to look for:
1. Plug-and-Play Integrations
You don’t want to spend weeks connecting your CRM, billing tool, product analytics, and SQL database. Look for tools that offer pre-built integrations with tools like HubSpot, Stripe, Segment, Mixpanel, and more.
2. Real-Time Data Updates
Time-lagged insights are as good as yesterday’s newspaper. The best dashboard tools offer real-time or near-real-time refresh rates.
3. User Behavior Insights
The best SaaS analytics dashboard tools let you visualize funnels, feature usage, and drop-offs, perfect for PLG models.
4. Customizable & Shareable Dashboards
Can you create views for different teams? Can stakeholders get a live link to the dashboard or receive automated reports? If yes, it’s a keeper.
5. Data Governance & Security
With tighter regulations and security scrutiny, enterprise-grade encryption and access control are a must.
The Top 6 Dashboard Reporting Tools for SaaS in 2025
Let’s get to what you came for.
1. PLG OS
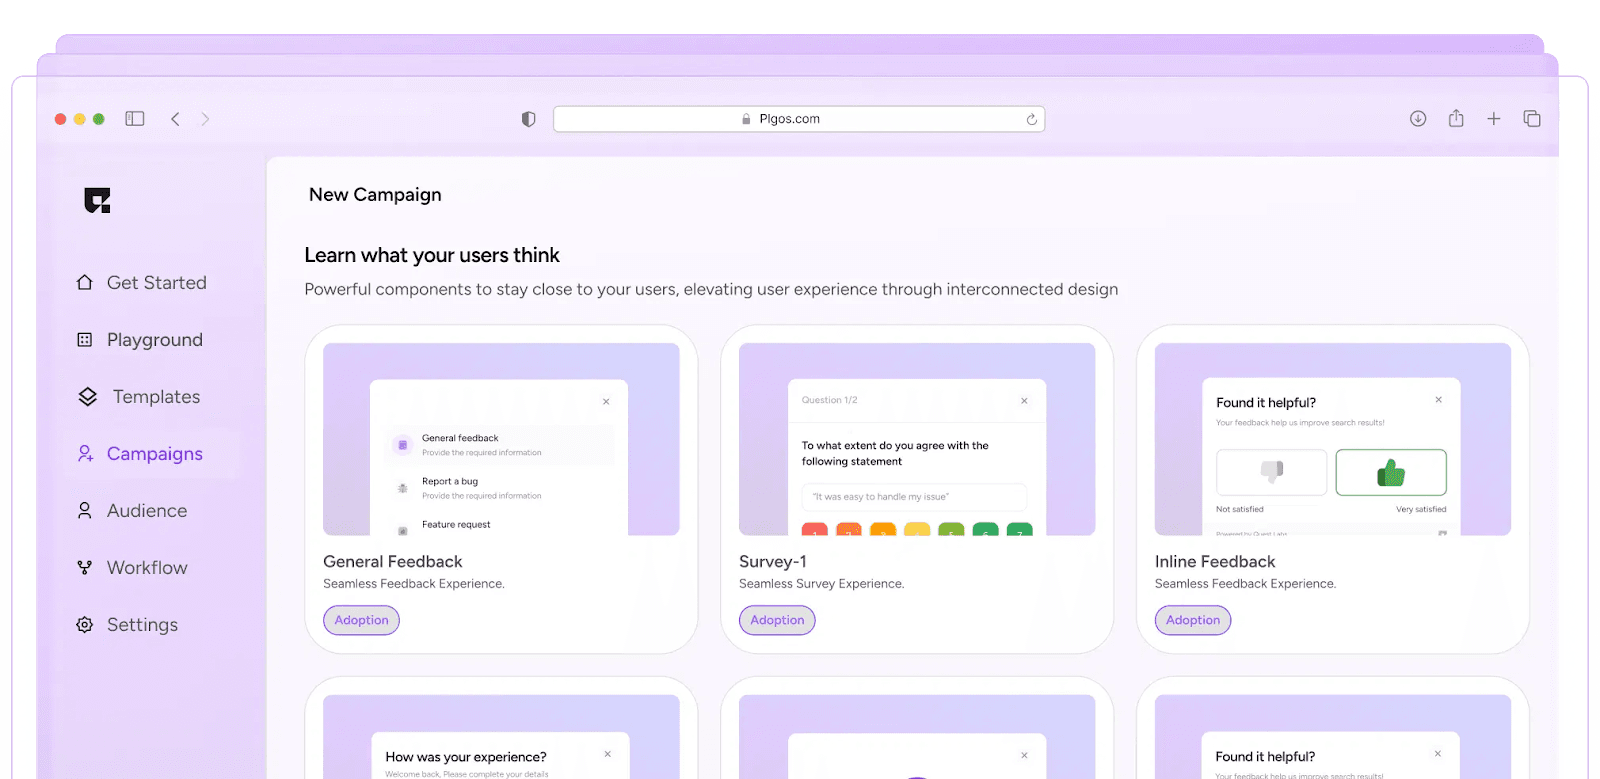
If you’re a SaaS company embracing product-led growth in 2025, you don’t just need analytics. You need an OS.
PLG OS is built ground-up for SaaS companies that grow through product usage, not just sales.
Why It Stands Out:
- Growth Loops Monitoring
- Track viral loops, referral rates, expansion revenue, and activation milestones. PLG OS doesn’t just visualize these metrics it helps you engineer, test, and optimize them.
- Built-In Experimentation
- Unlike typical dashboards, PLG OS enables you to build and run PLG experiments (like onboarding flows, pricing tests, or feature launches), and directly correlate them with key product and revenue metrics.
- In-App Feedback & Surveys: Know Instantly What Users Feel
- Don’t wait to guess what your users think ask them. With in-app surveys and feedback loops, PLG OS lets you:
- Learn how users rate your product experience
- Collect qualitative feedback in real-time
- Discover what users want next before your competitors do
- Bug Reporting: Let Users Improve Your Product
- Turn your user base into your QA team. Let users submit bugs and issues directly from inside your app. No more guesswork, no more support overload just real-time, actionable insight.
- Feature Requests: Ship with Confidence
- Considering launching a new feature? With PLG OS, you can capture user-driven feature requests, prioritize based on demand, and ship what users truly want reducing risk and increasing adoption.
- Blazingly Fast Setup
- Integrate PLG OS’s SDK in under 30 seconds. It’s built for speed and simplicity, so your team can stop waiting and start learning right away.
- Ideal for Product, Growth, and Success Teams
- PLG OS breaks down data silos by creating shared visibility across product usage, customer sentiment, and business outcomes. Whether you're optimizing onboarding, reducing churn, or testing pricing, everyone's working from the same playbook.
Who It's For:
- B2B SaaS with self-serve motion
- Startups scaling with freemium models
- Enterprises piloting PLG inside traditional models
Pro Insight:
What separates PLG OS from traditional reporting dashboard software is its strategic integration of growth models. You're not just visualizing data you’re building a PLG strategy inside your dashboard.
2. Looker
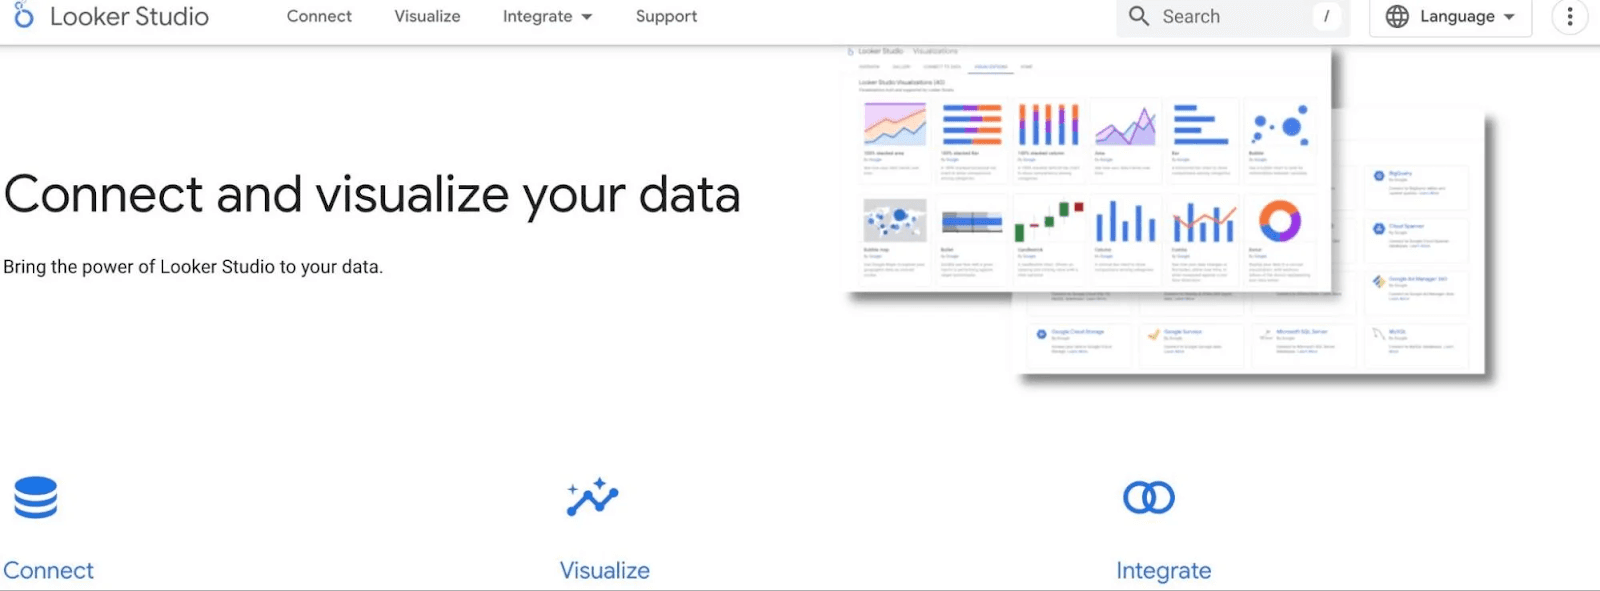
Looker continues to be one of the top business intelligence tools for SaaS in 2025. It’s powerful, developer-friendly, and deeply integrated with the Google Cloud ecosystem.
Why It Stands Out:
- Powerful Data Modeling (LookML): Helps build scalable, reusable data models.
- Embedded Analytics: Dashboards can be shared securely across orgs or embedded in your product.
- ML Integration: Works with Google Vertex AI for predictive analytics.
Who It’s For:
- Mid-to-enterprise SaaS companies
- Data teams with SQL/engineering resources
- Companies needing customizable reporting dashboards SaaS-wide
Pro Insight:
In 2025, Looker’s power is in custom data governance critical for SaaS companies scaling globally with multiple product lines.
3. ChartMogul
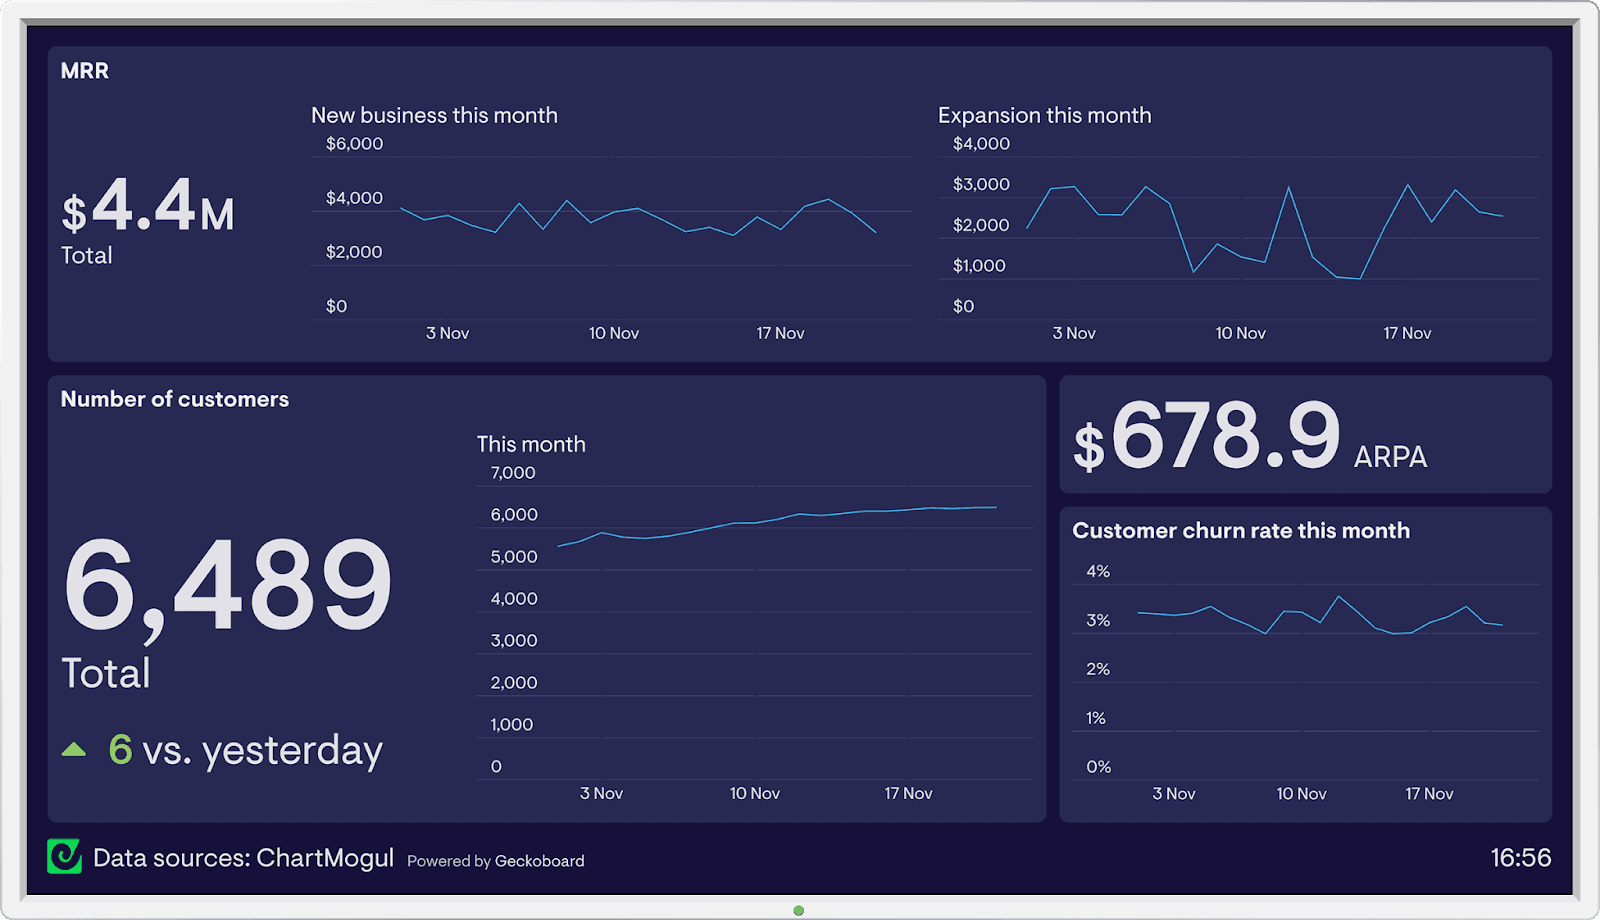
When it comes to subscription analytics, ChartMogul is the go-to reporting dashboard software trusted by finance, ops, and founders alike.
Why It Stands Out:
- Out-of-the-Box SaaS Metrics: MRR, Churn, LTV, CAC all pre-built and benchmarked.
- Data Enrichment: Combines customer data with CRM, billing, and support tools.
- Cohort & Segmentation Reporting: Helps spot patterns across customers, plans, geographies.
Who It’s For:
- Bootstrapped SaaS startups to post-Series B companies
- Subscription-based business models
- Finance and RevOps teams
Pro Insight:
In 2025, ChartMogul’s visual simplicity paired with data depth makes it indispensable. It’s not fancy it’s fast, focused, and financially insightful.
4. Databox
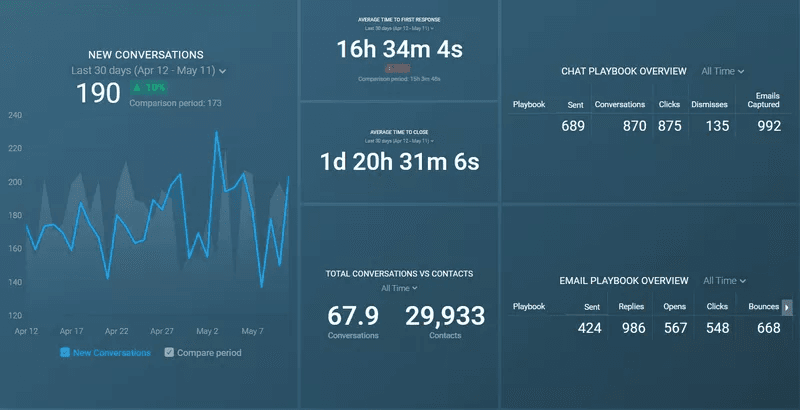
Need to build a dashboard before your next investor call... and you’ve got an hour? Databox is your new best friend.
Why It Stands Out:
- Plug-and-Play Integrations: From HubSpot to Stripe, with over 100 data sources.
- Mobile-First Experience: Real-time KPIs in your pocket.
- Custom Alerts & Goals: Set and forget (but get reminded when metrics spike).
Who It’s For:
- Growth teams, marketing leads, and founders
- SMB SaaS companies
- Non-technical teams needing immediate insights
Pro Insight:
What Databox lacks in deep analytics, it makes up for in accessibility and speed. It’s the “Google Slides” of SaaS dashboard reporting tools clean, quick, and widely loved.
5. Tableau
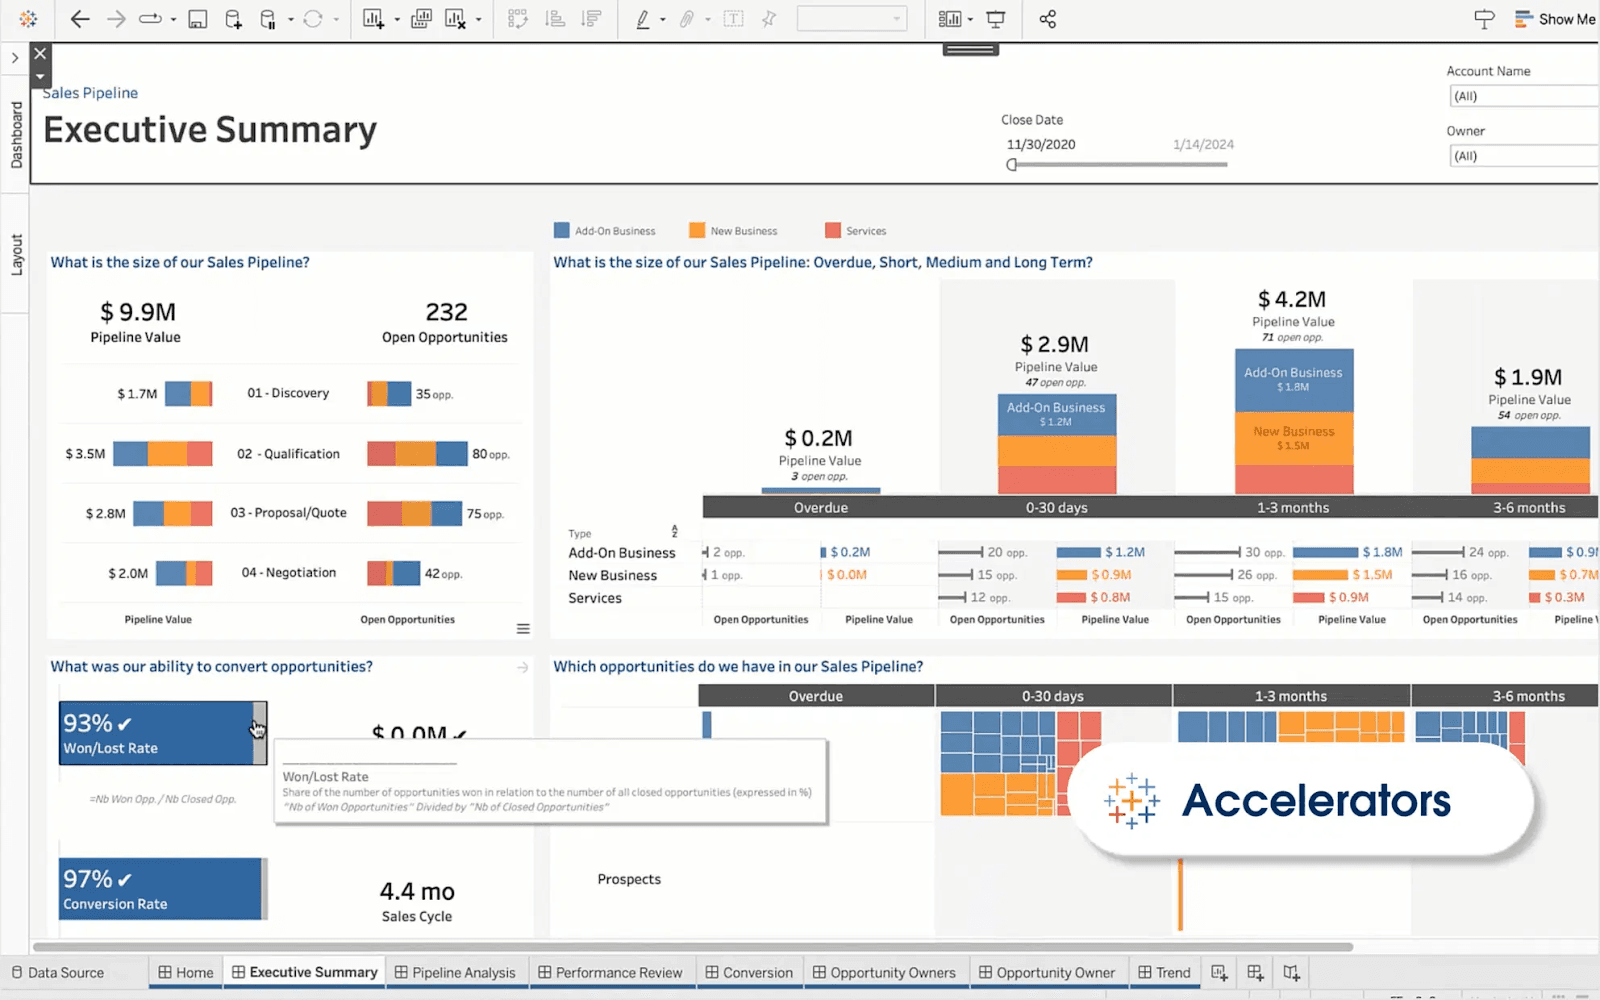
Tableau is not just a dashboard tool it’s a data storytelling platform. In 2025, Tableau continues to evolve, with better AI integration and real-time interactivity.
Why It Stands Out:
- Stunning Visuals: Great for internal presentations or board reports.
- Smart AI-Powered Insights: Ask data questions in natural language.
- Cross-Platform Compatibility: Desktop, web, mobile, cloud seamless switching.
Who It’s For:
- Data-driven SaaS teams
- Companies with analysts or BI resources
- Stakeholder presentations and insights storytelling
Pro Insight:
For product demos, investor decks, or C-suite reporting, Tableau dashboards communicate more than data they convey confidence.
6. Klipfolio
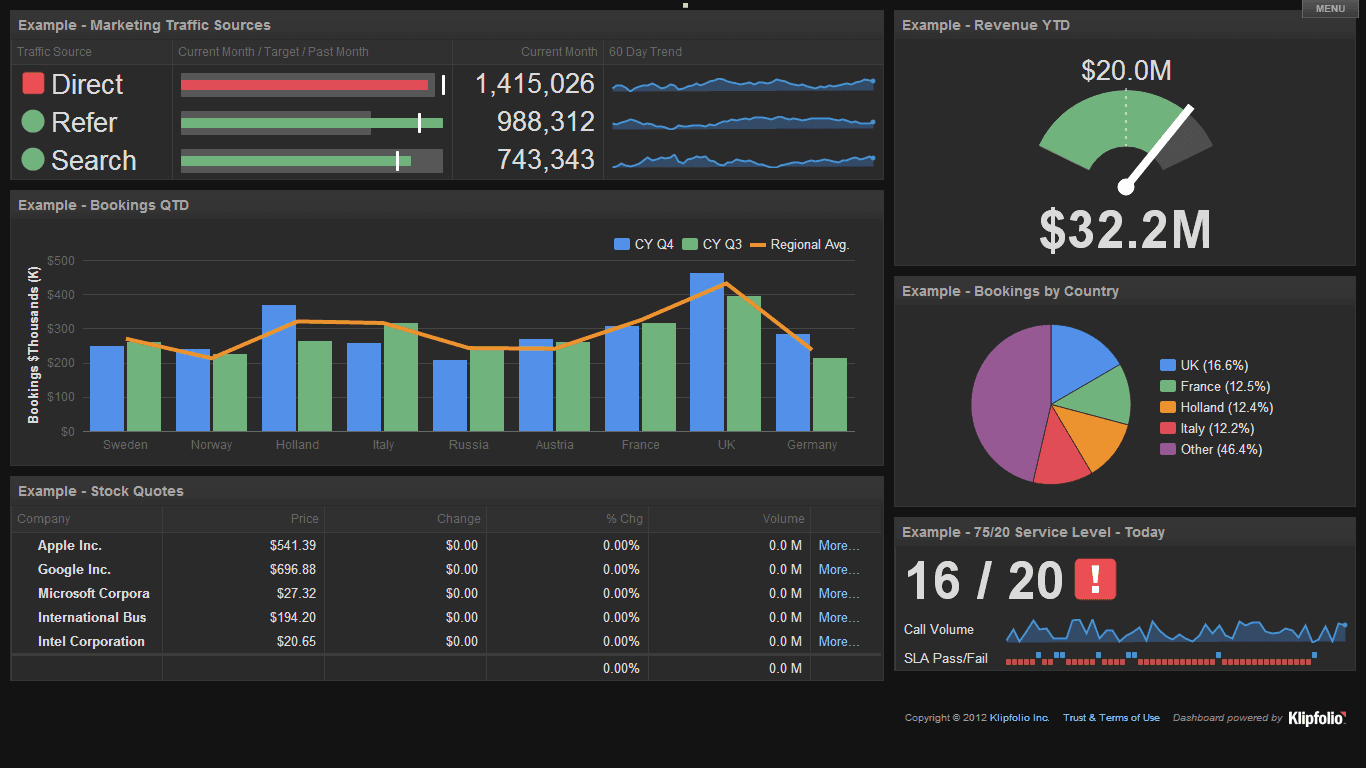
Klipfolio is the underdog SaaS dashboard reporting tool that packs more power than its price tag suggests.
Why It Stands Out:
- DIY Dashboards: Total flexibility in how you visualize KPIs.
- Real-Time Syncing: Pulls in data as it changes.
- Drag-and-Drop Interface: User-friendly even for non-analysts.
Who It’s For:
- Early-stage SaaS startups
- Agencies managing SaaS clients
- Founders building their own dashboards
Pro Insight:
Klipfolio is great for cross-channel metric unification from social to product usage to billing, all in one intuitive view.
How to Choose the Right SaaS Dashboard Tool in 2025
With so many powerful SaaS analytics dashboard tools, how do you know which one is right for you?
Here’s a quick checklist:
What’s Your Growth Motion?
- Product-led? Use PLG OS
- Sales-led? Looker or Tableau might be better
- Marketing-led? Databox or Klipfolio
Who’s Using It?
- Founders & execs? Focus on visuals and summaries
- Product teams? Go deep on behavioral analytics
- RevOps/Finance? Pick tools with financial depth like ChartMogul
Do You Need AI or Just KPIs?
- AI-powered insights? Looker and Tableau
- Clean metrics without complexity? ChartMogul, PLG OS, Databox
What’s Your Budget?
- Budget-friendly: Klipfolio, Databox
- Scalable & powerful: Looker, Tableau
- Freemium-to-pro motion: PLG OS
If Looker or Metabase is on your shortlist and price or setup is the concern, compare the Looker alternatives and Metabase alternatives we checked in October 2026.
Future Trends in SaaS Dashboard Reporting Tools (2025 & Beyond)
SaaS companies that implement in-app feedback tools report a 34% faster product iteration cycle. Let’s peek into the next wave of evolution:
1. Contextual Dashboards
Dashboards that change based on the user viewing them. A product manager sees usage patterns, a CMO sees ROI, and a CX leader sees support tickets all in the same platform. 74% of SaaS founders consider real-time dashboards essential for investor reporting and fundraising.
2. PLG-Centric Metrics
As PLG becomes mainstream, dashboards like PLG OS will dominate by offering user journey analytics, activation loop insights, and embedded experimentation.
3. Collaborative Dashboards
Think Google Docs, but for metrics. Comment, annotate, tag teammates turn insights into action together.
4. Predictive & Prescriptive Analytics
Not just “What happened?” but “What’s likely to happen next?” Tools will guide your growth actions automatically.
Final Thoughts
In 2025, your dashboard isn’t just a data visualization tool it’s your strategy compass.
And whether you’re looking to scale via PLG, expand enterprise revenue, or reduce churn the right reporting dashboard software can become your growth engine.
Each of the tools above has its superpowers:
- PLG OS is redefining how growth teams think.
- ChartMogul speaks the language of revenue.
- Looker empowers data teams to build bespoke dashboards.
- Databox brings speed and simplicity.
- Tableau tells stories with beauty and depth.
- Klipfolio makes budget-conscious SaaS founders look like dashboard wizards.
Choose the tool that aligns not just with your data but with your vision.
FAQs
1. What is the best dashboard reporting tool for product-led SaaS companies in 2025?
PLG OS is purpose-built for product-led growth. It offers real-time customer journey tracking, in-app feedback collection, and growth experimentation making it the top choice for PLG-focused SaaS teams.
2. Can I collect user feedback directly within my dashboard tool?
Yes, PLG OS allows in-app surveys and bug reporting. You can instantly learn how users feel, what they want next, and even involve them in product improvement.
3. Are these tools suitable for non-technical teams?
Absolutely. Tools like Databox and Klipfolio are designed for non-technical users, offering drag-and-drop dashboards and no-code integrations.
4. Which dashboard tools support real-time analytics?
Tools like PLG OS, Looker, Databox, and ChartMogul support real-time or near real-time data syncing, so you never make decisions on outdated metrics.
5. How quickly can I set up PLG OS?
PLG OS offers an SDK integration that takes less than 30 seconds. It’s built to be blazingly fast to set up, so you can start collecting insights immediately.