9 Early Metrics That Predict PLG Success
Product-Led Growth (PLG) is no longer a buzzword; it’s a battlefield. Everyone is talking about it, but few companies actually know how to measure whether their PLG strategy is working before big revenue numbers appear.
That’s the catch: by the time you see revenue growth (or lack of it), it’s already too late.
The smartest PLG teams track a different set of early PLG metrics—signals that reveal whether users are actually on the path to becoming power users, champions, and eventually paying customers.
Let’s check out the 9 early metrics that predict PLG success, the ones you won’t find in surface-level dashboards.
What is PLG?
PLG (Product-Led Growth) is a business strategy where the product itself is the primary driver of user acquisition, retention, and expansion. Unlike traditional sales-led or marketing-led approaches, where revenue growth relies heavily on sales teams and campaigns, PLG empowers users to experience value directly through the product. 58% of B2B SaaS companies have adopted PLG.
Key characteristics of PLG:
- Self-service adoption: Users can sign up and start using the product without needing a sales rep.
- “Aha” moments: The product demonstrates value quickly, driving engagement and retention.
- Viral loops: Users naturally share and invite others, fueling organic growth.
- Data-driven optimization: Every user action provides insight to improve onboarding, feature adoption, and expansion.
Popular PLG examples include Slack, Figma, Notion, and Dropbox, where free or low-friction access encourages adoption before conversion to paid tiers.
Benefits of PLG in SaaS
Among companies with an existing PLG strategy, 91% plan to increasetheir investment in Product-Led Growth initiatives, reflecting confidence in the effectiveness of this approach. Implementing a PLG strategy in a SaaS business brings multiple advantages:
1. Lower Customer Acquisition Costs (CAC)
PLG relies on the product to sell itself. Features like free trials, self-serve onboarding, and referral mechanisms reduce reliance on paid marketing or large sales teams.
2. Faster User Adoption
When users can experience the value of your SaaS product immediately, they are more likely to engage and integrate it into daily workflows. Quick activation drives retention and reduces churn.
3. Scalable Growth
PLG allows SaaS companies to grow without a linear increase in sales and marketing headcount. As the product spreads organically, each new user can potentially bring in more users through virality.
4. Better Product-Market Fit Insights
PLG encourages continuous measurement of product-led growth metrics, such as feature adoption rate, time-to-value, and retention cohorts. This data helps teams refine the product and address gaps early.
5. Stronger Customer Retention and Expansion
By focusing on value delivery first, PLG nurtures loyal users who are more likely to upgrade, expand, and advocate for the product. Metrics like average revenue per user (ARPU) and net revenue churn help track this growth.
6. Alignment Across Teams
PLG shifts focus from pure sales targets to product performance. Marketing, product, and customer success teams work together to optimize the product experience, creating a unified growth engine.
Why Early PLG Metrics Matter
Traditional SaaS growth models rely on sales pipelines, quarterly targets, and closed-won deals. PLG flips this. Instead of sales reps pushing the product, the product itself becomes the primary growth engine. Companies leading in Product-Led Growth experience 50% year-over-year growth, significantly outpacing traditional SaaS companies, which average around 21% growth.
That means user behavior—not pipeline stages—becomes the first true indicator of growth potential.
If you’re only tracking lagging indicators like MRR or ARR, you’ll miss the subtle signals that reveal whether your product is truly “self-selling.”
Early PLG metrics give you:
- Predictability – Spot growth (or churn) before it shows up in revenue.
- Clarity – See what’s actually driving adoption instead of guessing.
- Leverage – Double down on what works early, before competitors catch on.
But which metrics really matter? Let’s break them down.
The 9 Early Metrics That Predict PLG Success
1. Feature Adoption Rate
If users aren’t adopting your core features, they’re not on the path to expansion.
Feature adoption rate measures the percentage of active users who engage with a key feature during a given period.
Formula:
Feature Adoption Rate = (# of users who used feature ÷ # of active users) × 100
Why it matters:
- It reveals whether users are discovering and using your product’s value drivers.
- It highlights “aha moment” bottlenecks—places where users drop off before reaching value.
Example:
If only 15% of free users are adopting your collaboration feature, your virality potential is limited. That’s not just a product problem—it’s a growth ceiling.
How PLG OS Helps:
PLG OS lets you tie feature adoption directly to account outcomes. Instead of just knowing a feature is underused, you can see whether under-adoption correlates with lower expansion revenue or higher net revenue churn.
2. Time-to-Value (TTV)
The faster users get to their first “aha,” the more likely they’ll stick around.
TTV measures how long it takes a new user to experience the core value of your product.
- For Slack, it’s sending the first message with teammates.
- For Figma, it’s collaborating in real time on a design file.
- For Notion, it’s creating and sharing a workspace.
Why it matters:
- Long TTV = high drop-off.
- Short TTV = better activation, higher retention, faster upgrades.
Pro Tip: Don’t just measure “first login.” Measure first value moment when users actually succeed with the product.
How PLG OS Helps:
With PLG OS, you can define what “value” means for your product and track whether new users hit that milestone. That lets you segment users into activated vs. non-activated cohorts and see how activation affects downstream metrics like average revenue per user (ARPU).
3. Daily, Weekly, and Monthly Active Users (DAU/WAU/MAU Ratio)
Raw usage numbers don’t tell you much. But engagement ratios do.
The DAU/WAU/MAU ratio tells you if your product is becoming a daily (or at least habitual) part of users’ workflows.
- DAU/WAU Ratio = Stickiness.
- WAU/MAU Ratio = Retention health.
Why it matters:
- High stickiness means your product isn’t just nice-to-have—it’s essential.
- Low stickiness often predicts churn, even if MAU looks stable.
Example
If you have 10,000 MAUs but only 500 DAUs, you don’t have product-led growth. You have casual usage, and casual users don’t expand or upgrade.
How PLG OS Helps:
Instead of tracking DAU in isolation, PLG OS ties activity ratios to conversion funnels. That means you can see if users who log in daily are also the ones driving revenue.
4. Activation Rate
Think of activation rate as the “graduation percentage” of your free or trial users.
It’s the proportion of sign-ups that actually reach the key activation milestone.
Formula:
Activation Rate = (# of users who reach activation milestone ÷ # of sign-ups) × 100
Why it matters:
- Low activation = wasted acquisition spend.
- High activation = a self-sustaining growth loop.
Example
Dropbox measured activation as “user uploads at least one file.” If someone never uploaded, they were a churn risk from day one.
How PLG OS Helps:
PLG OS lets you define multiple activation paths—critical if your product serves different personas. You can see whether marketing is bringing in the “right” users or just filling the funnel with noise.
5. Average Revenue Per User (ARPU)
While Average Revenue Per User is often seen as a lagging revenue metric, it’s also a predictive PLG signal.
Why? Because in PLG models, upgrades and expansions often happen organically inside accounts. Tracking ARPU across cohorts can reveal whether users are naturally expanding.
Why it matters:
- Rising ARPU = users are adopting premium features, seats, or add-ons.
- Flat or declining ARPU = product value is capped or pricing isn’t aligned.
Example
If free-to-paid conversion is high but ARPU is stagnant, you may be over-indexed on small accounts while missing enterprise potential.
How PLG OS Helps:
PLG OS connects ARPU trends with feature usage. You can see not only who’s paying more, but why—which features correlate with higher ARPU.
6. Expansion Revenue vs. Net Revenue Churn
In PLG, expansion is king. It’s not just about winning logos—it’s about growing accounts.
Two critical early PLG metrics here are:
- Expansion Revenue: Revenue from upsells, add-ons, and seat increases.
- Net Revenue Churn: (Churned revenue – Expansion revenue) ÷ Starting revenue.
Why it matters:
- Expansion > Churn = healthy PLG flywheel.
- Expansion < Churn = leaky bucket, regardless of top-of-funnel growth.
Example
If your self-serve accounts upgrade fast but churn just as quickly, your PLG motion isn’t sustainable.
How PLG OS Helps:
Instead of waiting for quarterly churn reports, PLG OS lets you monitor early expansion signals, like feature adoption spikes or new team invitations, so you can predict account growth before it shows up in billing.
7. Virality & Invite Rate
Great PLG products spread themselves. One user brings another.
The invite rate measures how many users are inviting teammates, collaborators, or colleagues.
Why it matters:
- Virality lowers your cost of acquisition (CAC).
- A strong invite loop = exponential growth.
- A weak invite loop = paid acquisition treadmill.
Example
Miro’s PLG success hinged on team invites. A board with one person wasn’t sticky—but with five collaborators, it became indispensable.
How PLG OS Helps:
PLG OS tracks how invite behavior connects to retention and ARPU. That means you can prioritize features (or onboarding steps) that encourage sharing and collaboration.
8. Product Qualified Leads (PQLs)
Not all sign-ups are created equal. That’s why PQLs are the lifeblood of PLG.
A PQL is a user or account that demonstrates buying intent through product usage—not just form fills.
Why it matters:
- PQLs are far more predictive of revenue than MQLs.
- They bridge product usage and sales conversations.
Example
If a free user hits seat limits, integrates with multiple tools, or invites their team, that’s a PQL worth sales follow-up.
How PLG OS Helps:
PLG OS gives you a real-time PQL dashboard. You can define triggers (like hitting feature thresholds or usage milestones) and surface those accounts to sales before competitors do.
9. Retention Cohorts
Retention is the ultimate PLG metric. If users don’t stay, nothing else matters.
But instead of looking at aggregate churn, track cohort retention curves how users from different months, acquisition channels, or personas behave over time.
Why it matters:
- Cohort analysis shows whether your product is actually improving.
- Flatlining curves = strong product-market fit.
- Declining curves = acquisition masking churn.
Example
If your retention curve for users acquired via paid ads plummets, but organic cohorts stabilize, you know your problem isn’t product—it’s acquisition quality.
How PLG OS Helps:
PLG OS makes cohort analysis actionable. Instead of static charts, you can tie retention dips to specific feature adoption gaps or onboarding friction points.
Building a PLG Metrics Framework
Tracking these 9 metrics separately is powerful. But the real magic happens when you connect them.
Here’s how to think about it:
- Acquisition Quality – PQLs, invite rate.
- Activation & Adoption – Time-to-value, feature adoption, activation rate.
- Engagement & Stickiness – DAU/WAU/MAU ratios, retention cohorts.
- Monetization & Growth – ARPU, expansion revenue, net revenue churn.
Every healthy PLG company balances these four layers.
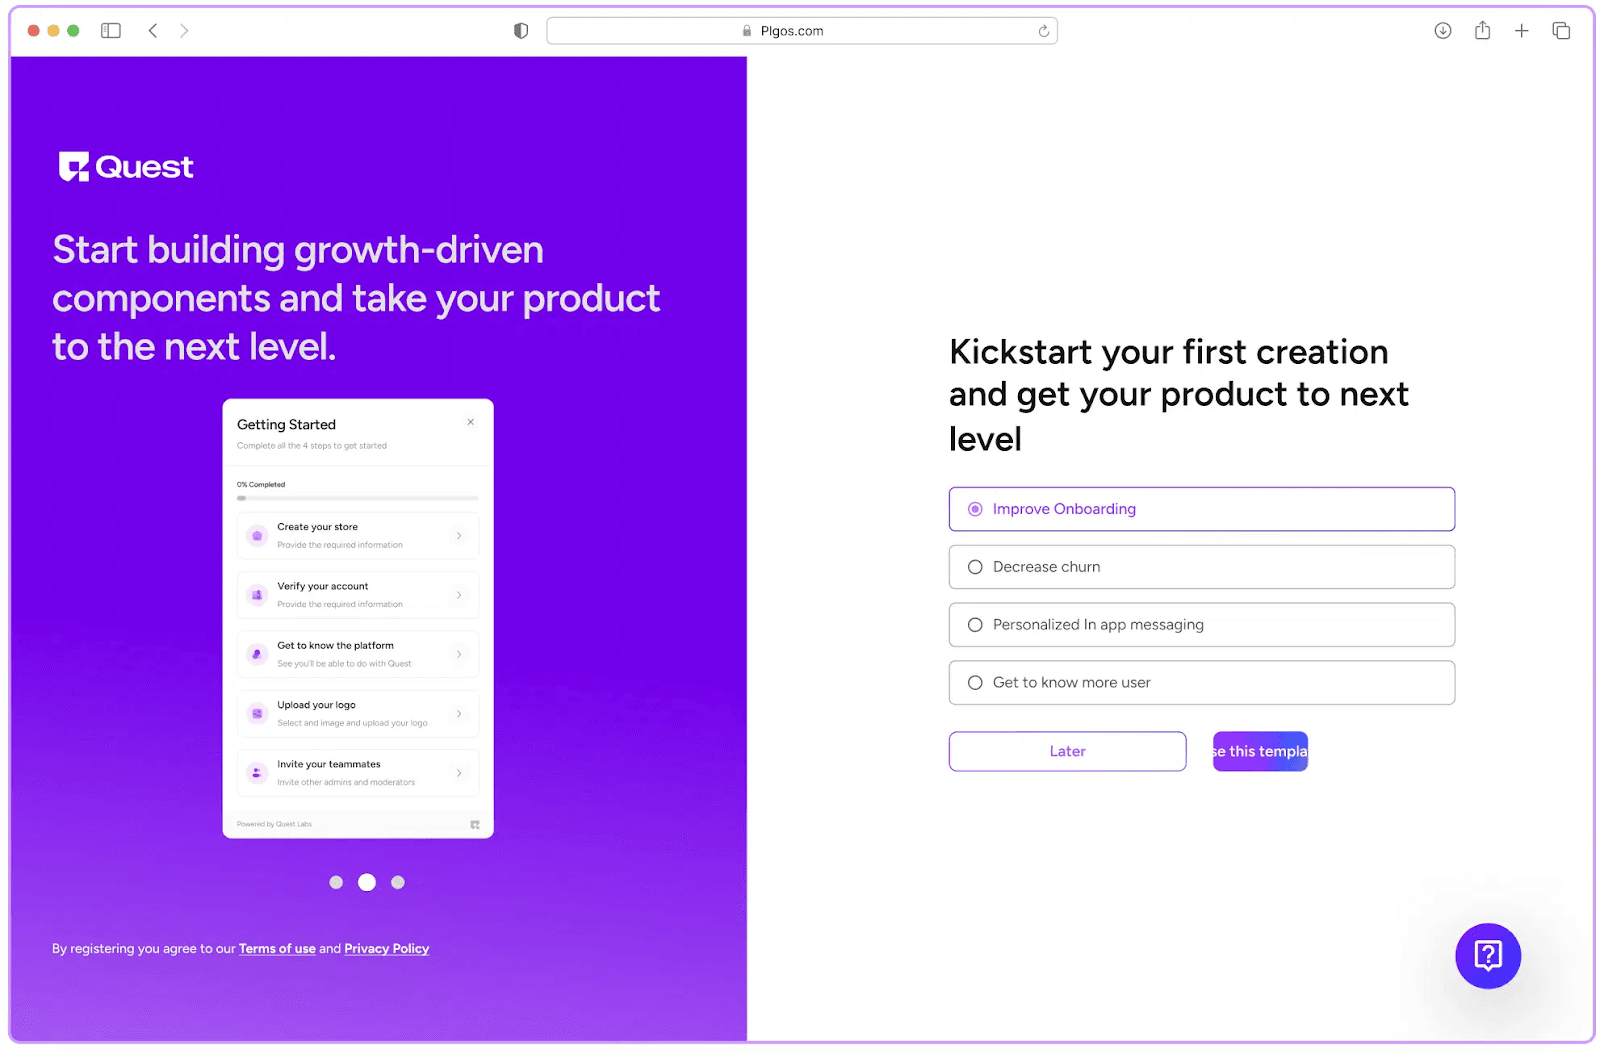
And this is where PLG OS becomes a game-changer: instead of stitching together spreadsheets, analytics dashboards, and CRM exports, PLG OS gives you a single operating system to measure, track, and act on these metrics.
The Takeaway
Product-Led Growth isn’t about luck. It’s about listening to your product data early and acting before revenue tells the story for you.
By tracking these 9 early PLG metrics, you’ll know whether your PLG motion is healthy long before board meetings, revenue reviews, or churn reports.
The best PLG teams don’t just track these metrics. They operationalize them.
And with a platform like PLG OS, you can stop drowning in disjointed dashboards and start running PLG like a science. Because in the end, the companies that win at PLG aren’t the ones with the loudest marketing campaigns. They’re the ones who know, measure, and act on the signals that actually predict success.
FAQs
1. What does PLG stand for?
PLG stands for Product-Led Growth, a strategy where the product itself drives user acquisition, retention, and expansion.
2. How is PLG different from traditional growth strategies?
Unlike sales-led or marketing-led approaches, PLG relies on users experiencing product value directly, often through free trials or self-service onboarding.
3. What are the key metrics for PLG?
Some important Product-Led Growth metrics include feature adoption rate, time-to-value, activation rate, average revenue per user (ARPU), and net revenue churn.
4. Why is PLG effective for SaaS companies?
PLG lowers acquisition costs, increases user adoption, improves retention, and creates scalable growth by turning the product into the primary growth engine.
5. Can PLG work alongside sales and marketing teams?
Yes. PLG complements traditional teams by generating Product Qualified Leads (PQLs), providing high-quality prospects for sales while letting the product drive initial adoption.