Mixpanel vs Amplitude: Is There a Better Alternative?
When teams talk about product analytics, two names dominate the discussion: Mixpanel and Amplitude. Both tools have shaped how modern SaaS companies track, measure, and interpret user behavior.
But the landscape has evolved. Today’s product-led growth (PLG) companies demand more than dashboards, they need systems that not only report what’s happening but also act on that data in real time.
So, the question many product teams are asking now is:
Are Mixpanel and Amplitude still enough, or is there a better, more adaptive alternative?
Enter PLG OS, a unified Product-Led Growth system designed to optimize onboarding, assist users, automate feedback, and make product experiences smarter with each interaction.
Let’s explore how Mixpanel and Amplitude compare, and why PLG OS is fast becoming the modern alternative for teams focused on action, not just analytics.
The Evolution of Product Analytics
Product analytics used to mean dashboards, funnels, and retention charts. Mixpanel and Amplitude excelled at that, they gave teams quantitative insights into what users were doing inside their products.
But analytics alone is no longer enough.
Modern product teams want to know why users behave a certain way, not just how. They need to see the story behind the numbers, and be able to respond automatically when users get stuck, churn, or lose interest.
This shift from visibility to actionability is where traditional analytics platforms start to show their limits.
Mixpanel: Features and Pricing
Core Features
Mixpanel is known for its event-based analytics and ability to track user behavior at a granular level. Its core strengths lie in understanding what users do inside a product and how those actions impact retention and conversion.
Key features include:
- Event-based tracking: Capture every user action to understand engagement and product usage patterns.
- Funnels and retention analysis: Measure drop-offs and identify steps that impact conversion or churn.
- Cohort segmentation: Group users based on shared behaviors for targeted analysis or campaigns.
- Custom dashboards and formulas: Build reports that track KPIs and visualize performance trends.
- Group analytics: Analyze data at an account or company level (useful for B2B SaaS).
- Data pipelines and integrations: Export data to warehouses or connect with marketing and CRM tools.
- Governance and access control: Manage data quality, roles, and permissions for enterprise teams.
Pricing
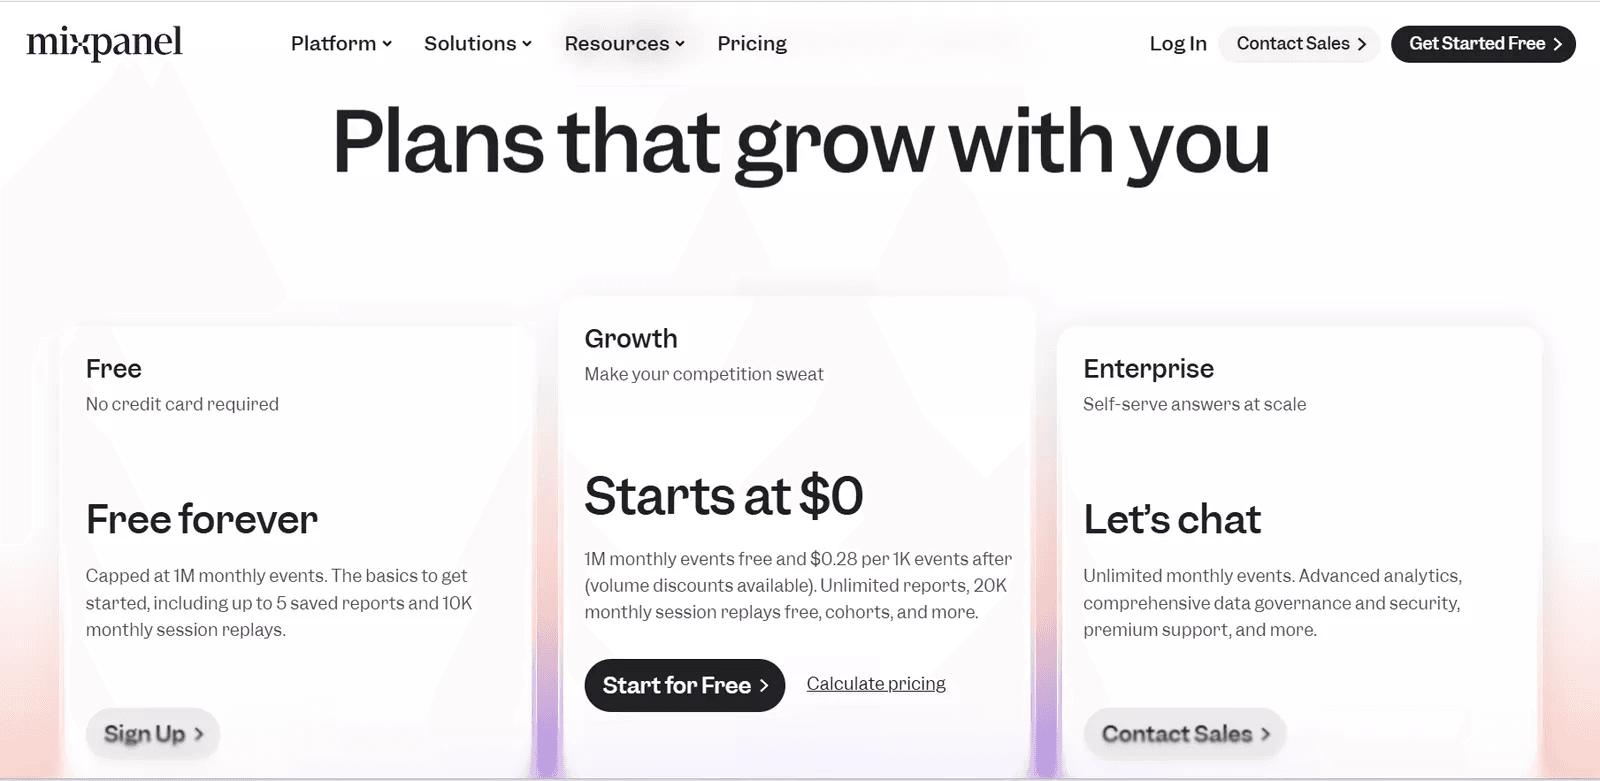
Mixpanel offers a tiered pricing model that scales with event volume:
Free Plan:
- Up to 1 million monthly events.
- Core analytics and limited saved reports.
- Ideal for startups or teams beginning with product analytics.
Growth Plan:
- Starts around $20–$25 per month, scaling with usage.
- Includes unlimited saved reports, data modeling, and advanced segmentation.
- Designed for growing teams needing deeper insights.
Enterprise Plan:
- Custom pricing.
- Includes advanced data governance, single sign-on (SSO), and dedicated support.
- Best for large organizations with complex data infrastructure.
Pricing note: Mixpanel’s cost scales based on the number of tracked events, which can increase quickly as your product grows. Some enterprise customers also use MTU-based pricing (monthly tracked users) for predictability. A comparison of customer base data : In the mobile-analytics category, Mixpanel had ~48,535 customers and ~7.60% market share; Amplitude ~27,108 customers and ~4.25% share.
Amplitude: Features and Pricing
Core Features
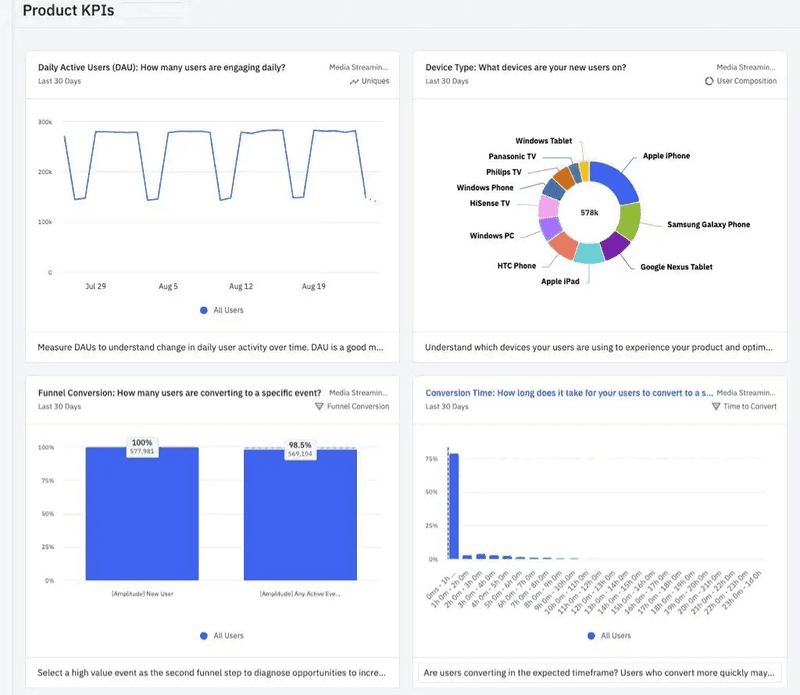
Amplitude provides deep behavioral analytics with an emphasis on user journeys, segmentation, and predictive insights. It’s often preferred by data-heavy organizations for its scalability and experimentation features.
Key features include:
- Behavioral analytics and segmentation: Understand how different user cohorts behave and interact with features.
- User journey mapping: Visualize how users move through the product from start to conversion or drop-off.
- Funnel and retention tracking: Pinpoint friction points across the user experience.
- Experimentation tools: Test feature variations and measure their impact on engagement or retention.
- Predictive insights and causal analysis: Identify key drivers behind user actions and forecast outcomes.
- Feature flags and real-time streaming: Launch new features safely and observe real-time reactions.
- Data governance and cross-product analysis: Ideal for organizations managing multiple products.
Pricing
Amplitude uses a mix of monthly tracked users (MTUs) and event volume to determine cost.
Starter (Free) Plan:
- Up to 50,000 monthly tracked users or 10 million monthly events.
- Includes basic analytics, cohorts, and simple dashboards.
- Suitable for early-stage companies or testing.
Plus Plan:
- Starts around $49 per month when billed annually.
- Offers more MTUs and access to behavioral cohorts, templates, and enhanced reporting.
- Best for small-to-mid teams needing scalable insights.
Growth Plan:
- Custom pricing for larger organizations.
- Includes advanced analytics, real-time streaming, and deeper segmentation.
Enterprise Plan:
- Fully customized pricing.
- Adds enterprise-grade governance, experimentation tools, and premium support.
Pricing note: While Amplitude’s free tier is generous, costs can increase quickly as event or MTU counts scale. Pricing also becomes less transparent at higher tiers.
Mixpanel vs Amplitude: Why You Might Need a Better Alternative
After extensive work with both Mixpanel and Amplitude, I’ve found that while these product analytics tools deliver rich quantitative insights into user behavior, they often fall short in terms of context and actionability.
According to a benchmark report by Mixpanel, in 2023 the average company using Mixpanel generated 128 reports per year, up 16% from 2022. Also, more than 406,000 people viewed Mixpanel reports in 2023, a 19% increase from the prior year.
For organizations focused on data infrastructure or advanced analytics, the depth these platforms offer is unmatched. But for product teams that prioritize rapid iteration and continuous improvement, this same depth can actually slow progress.
Here’s where the cracks begin to show:
1. Fragmented Insight-to-Action Workflow
Both platforms excel at collecting and visualizing data, but moving from insight to action usually requires other tools.
Without native options for onboarding, in-app feedback, or contextual messaging, teams end up managing multiple disconnected systems that slow down workflows and reduce agility.
2. An Action Layer That’s Still Secondary
Amplitude has introduced add-ons like Guides and Surveys to connect analytics with engagement, but these are only available in higher-tier plans and still limited in capability.
Mixpanel, meanwhile, doesn’t include any native in-app engagement tools. The result is the same: teams rely on external integrations that add cost, complexity, and friction.
3. Heavy Developer Dependency for Simple Tasks
Setting up new events, experiments, or even a quick survey still requires developer assistance in both tools. This dependence reduces agility and slows down iteration, exactly the opposite of what modern PLG teams need.
The next question becomes obvious:
Is there a better alternative for product teams that want a platform combining behavioral analytics, qualitative insights, and in-app engagement, without depending on engineers or managing multiple tools?
That’s precisely where PLG OS comes in.
PLG OS: A Unified System for Product-Led Growth
PLG OS isn’t just another analytics platform, it’s a complete Product-Led Growth Operating System.
It merges behavioral analytics, AI-powered feedback systems, real-time user assistance, and engagement automation into one seamless platform.
Instead of juggling data visualization tools, survey systems, and onboarding solutions, PLG OS gives teams everything they need to turn insights into action, instantly.
Let’s break down how it works.
1. Optimizing Onboarding
Traditional analytics tools can show where users drop off during onboarding. PLG OS goes further by helping you fix those drop-offs automatically.
- Detects friction points in real time using behavior data.
- Triggers personalized in-app messages or tutorials when users stall.
- Uses feedback automation with AI to collect insights from users who abandon key steps.
This system ensures that every user reaches value faster, and continuously improves the onboarding experience without manual intervention.
2. Expediting Time to Value
One of the biggest challenges in SaaS is helping users reach their “aha” moment quickly. PLG OS continuously tracks user progress and appliesreal-time feedback analysis to identify bottlenecks.
If users hesitate or drop off, it can instantly respond with contextual help, micro-surveys, or guided walkthroughs.
Over time, these interactions create a self-optimizing feedback loop, helping teams measure and reduce time-to-value with every iteration.
3. User Assistance: Unsticking Users Instantly
While Mixpanel and Amplitude can reveal where users struggle, PLG OS actually assists them in that moment.
It detects frustration signals, like repeated clicks, long idle times, or navigation loops, and provides contextual help automatically.
This built-in user assistance layer means users spend less time stuck and more time engaging productively.
Every help interaction also feeds into PLG OS’s feedback management with AI, ensuring the system learns from each case to provide smarter assistance over time.
4. Feedback and Surveys: Understanding the Why
Numbers tell part of the story, feedback completes it.
PLG OS integrates feedback and survey collection directly into the analytics workflow.
Teams can:
- Trigger surveys at key points in the user journey.
- Automate feedback collection and categorize responses with AI.
- Combine sentiment data with behavioral analytics for deeper context.
This approach transforms feedback from a separate process into an integral part of user experience optimization. Teams no longer guess why metrics shift — they know, in real time.
5. Loyalty and Engagement: Turning Users into Advocates
Engagement isn’t just about keeping users active, it’s about making the product rewarding to use.
PLG OS includes loyalty and gamification tools that make engagement measurable and sustainable:
- Reward systems for completing key milestones.
- Progress tracking that shows users their growth.
- Automated re-engagement campaigns powered by AI feedback analytics.
Instead of measuring engagement after the fact, PLG OS helps create it, closing the loop between behavior and motivation.
Mixpanel vs Amplitude vs PLG OS: A Functional Comparison
| Capability | Mixpanel | Amplitude | PLG OS |
|---|---|---|---|
| Event-based tracking | ✅ | ✅ | ✅ |
| Journey visualization | ✅ | ✅ | ✅ |
| In-app onboarding | ❌ | Partial (add-on) | ✅ |
| Real-time feedback analysis | ❌ | Limited | ✅ |
| Automated user assistance | ❌ | ❌ | ✅ |
| Feedback automation | ❌ | ❌ | ✅ |
| AI feedback integration | ❌ | ❌ | ✅ |
| Loyalty & gamification | ❌ | ❌ | ✅ |
| Time-to-value tracking | ❌ | Limited | ✅ |
Building an Integrated Product-Led Growth Stack
SaaS teams often rely on a fragmented stack, analytics from one tool, surveys from another, engagement from a third.
While each tool performs well individually, the lack of integration slows everything down.
If you are still comparing tools beyond these two, our list of the best user behavior analytics software for SaaS covers nine options, from session replay and heatmaps to autocapture, with current prices.
PLG OS consolidates all of these capabilities into one ecosystem, creating a true Product-Led Growth stack that supports every stage of the user journey:
- Analyze behavior.
- Understand feedback.
- Automate action.
- Measure improvement.
Each step reinforces the next, creating a self-sustaining growth loop where user experience and product performance evolve together.
Trust, Transparency, and EEAT Compliance
As more platforms integrate automation and AI, trust becomes a central concern. PLG OS is built around EEAT principles, Expertise, Experience, Authoritativeness, and Trustworthiness, ensuring that its data processes and recommendations remain transparent, ethical, and verifiable.
- Expertise: Developed by product growth professionals with deep SaaS experience.
- Experience: Validated across multiple industries and user segments.
- Authoritativeness: Backed by proven PLG methodologies and continuous learning models.
- Trustworthiness: Compliant with data privacy standards and ethical AI practices.
The platform’s foundation isn’t just technical, it’s responsible.
Conclusion
Mixpanel and Amplitude remain excellent analytics tools for teams focused on quantitative data. But as product-led growth becomes the standard, the ability to act on insights instantly is now the defining advantage.
PLG OS represents that evolution, unifying analytics, feedback, and engagement into one continuous, automated system.
By integratingAI-powered feedback strategies, real-time feedback analysis, and automated user assistance, PLG OS helps teams move beyond dashboards and toward continuous improvement.
If your goal is to build a product that learns from every user and adapts automatically, PLG OS delivers the foundation for that future.
Visit PLG OS to see how growth-focused teams are turning data into immediate action and building products that guide, assist, and engage users on their own.
For the third option many teams are actually weighing, our Heap alternatives guide puts both of these next to PostHog and the honest GA4 downgrade.
If you are weighing other options besides these two, see our lists of Mixpanel alternatives and Amplitude alternatives, with free tiers and pricing checked in October 2026.
FAQs
1. What’s the main difference between Mixpanel, Amplitude, and PLG OS?
Mixpanel and Amplitude focus mainly on data analytics and visualization, while PLG OS integrates analytics, feedback, and engagement into one platform — turning insights into immediate actions without relying on multiple tools.
2. Does PLG OS replace traditional analytics tools?
PLG OS can complement or replace them. It offers analytics similar to Mixpanel or Amplitude but adds onboarding optimization, in-app feedback, and automation, creating a unified Product-Led Growth system.
3. How does PLG OS use AI in feedback management?
PLG OS applies AI feedback integration to collect, categorize, and analyze feedback in real time — helping teams understand user sentiment and behavior faster and act instantly.
4. Can PLG OS help reduce developer dependency?
Yes. PLG OS allows non-technical teams to set up surveys, onboarding flows, and engagement automation without engineering support, accelerating iteration and testing.
5. Is PLG OS suitable for startups or only large enterprises?
PLG OS is designed for scalability. Startups can begin with core features and scale up as their user base grows, while larger teams benefit from advanced automation and AI-driven analytics.